Yakama vs West Indian Per Capita Income
COMPARE
Yakama
West Indian
Per Capita Income
Per Capita Income Comparison
Yakama
West Indians
$33,009
PER CAPITA INCOME
0.0/ 100
METRIC RATING
336th/ 347
METRIC RANK
$41,217
PER CAPITA INCOME
6.0/ 100
METRIC RATING
225th/ 347
METRIC RANK
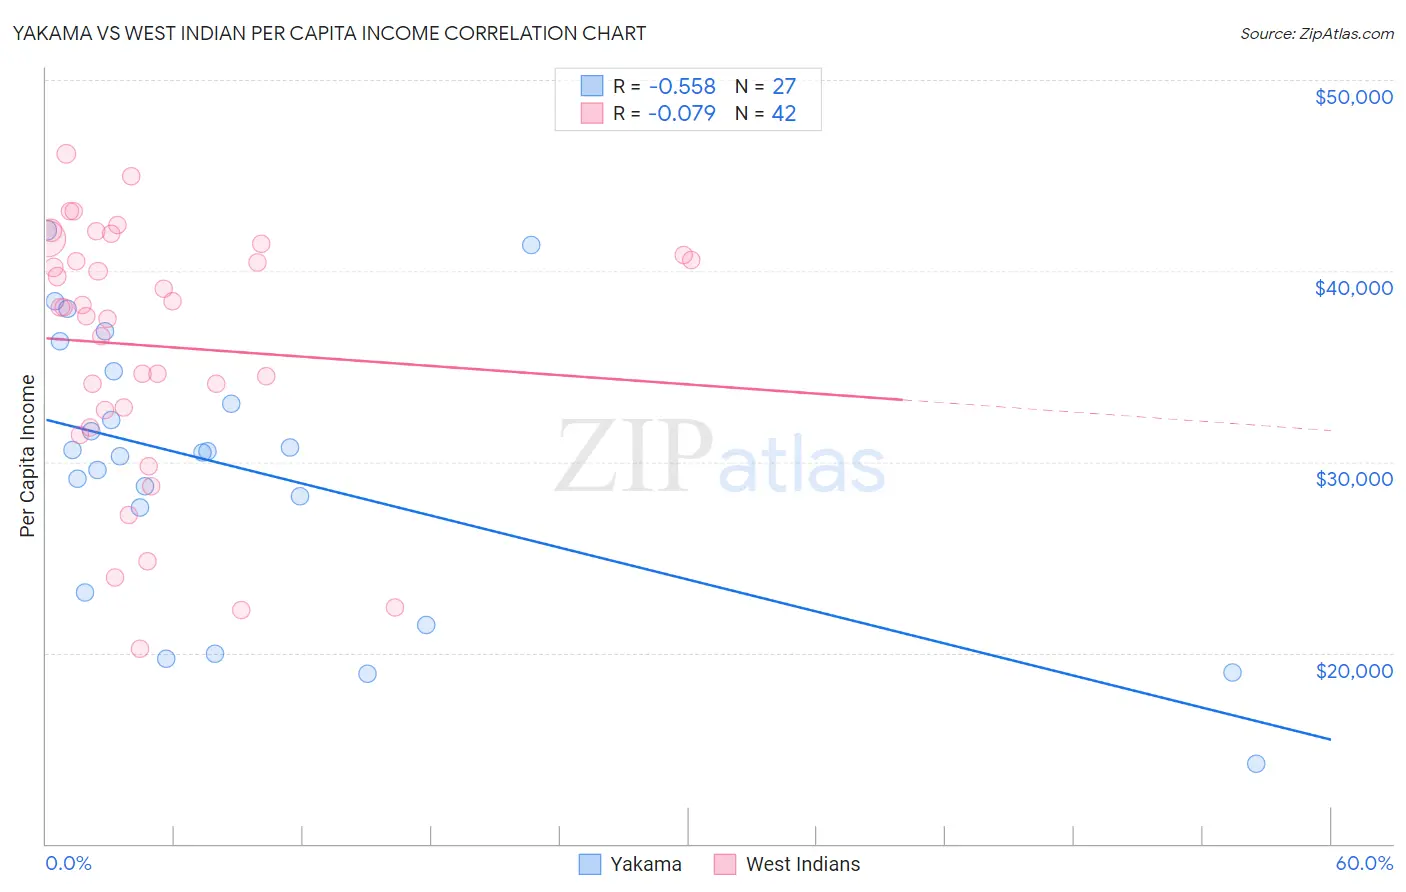
Yakama vs West Indian Per Capita Income Correlation Chart
The statistical analysis conducted on geographies consisting of 19,923,144 people shows a substantial negative correlation between the proportion of Yakama and per capita income in the United States with a correlation coefficient (R) of -0.558 and weighted average of $33,009. Similarly, the statistical analysis conducted on geographies consisting of 254,069,364 people shows a slight negative correlation between the proportion of West Indians and per capita income in the United States with a correlation coefficient (R) of -0.079 and weighted average of $41,217, a difference of 24.9%.
Per Capita Income Correlation Summary
| Measurement | Yakama | West Indian |
| Minimum | $14,175 | $20,227 |
| Maximum | $42,131 | $46,150 |
| Range | $27,956 | $25,923 |
| Mean | $29,512 | $36,063 |
| Median | $30,514 | $38,086 |
| Interquartile 25% (IQ1) | $23,165 | $32,716 |
| Interquartile 75% (IQ3) | $34,761 | $40,860 |
| Interquartile Range (IQR) | $11,597 | $8,144 |
| Standard Deviation (Sample) | $7,251 | $6,624 |
| Standard Deviation (Population) | $7,116 | $6,544 |
Similar Demographics by Per Capita Income
Demographics Similar to Yakama by Per Capita Income
In terms of per capita income, the demographic groups most similar to Yakama are Houma ($32,996, a difference of 0.040%), Yuman ($33,236, a difference of 0.69%), Native/Alaskan ($33,279, a difference of 0.82%), Arapaho ($32,345, a difference of 2.1%), and Immigrants from Yemen ($33,696, a difference of 2.1%).
| Demographics | Rating | Rank | Per Capita Income |
| Mexicans | 0.0 /100 | #329 | Tragic $34,559 |
| Spanish American Indians | 0.0 /100 | #330 | Tragic $34,195 |
| Immigrants | Mexico | 0.0 /100 | #331 | Tragic $33,931 |
| Sioux | 0.0 /100 | #332 | Tragic $33,921 |
| Immigrants | Yemen | 0.0 /100 | #333 | Tragic $33,696 |
| Natives/Alaskans | 0.0 /100 | #334 | Tragic $33,279 |
| Yuman | 0.0 /100 | #335 | Tragic $33,236 |
| Yakama | 0.0 /100 | #336 | Tragic $33,009 |
| Houma | 0.0 /100 | #337 | Tragic $32,996 |
| Arapaho | 0.0 /100 | #338 | Tragic $32,345 |
| Pueblo | 0.0 /100 | #339 | Tragic $32,012 |
| Crow | 0.0 /100 | #340 | Tragic $31,729 |
| Puerto Ricans | 0.0 /100 | #341 | Tragic $31,268 |
| Hopi | 0.0 /100 | #342 | Tragic $31,177 |
| Pima | 0.0 /100 | #343 | Tragic $30,644 |
Demographics Similar to West Indians by Per Capita Income
In terms of per capita income, the demographic groups most similar to West Indians are Immigrants from Ecuador ($41,195, a difference of 0.050%), Immigrants from St. Vincent and the Grenadines ($41,270, a difference of 0.13%), Immigrants from Ghana ($41,131, a difference of 0.21%), Immigrants from Grenada ($41,123, a difference of 0.23%), and Immigrants from Cameroon ($41,334, a difference of 0.28%).
| Demographics | Rating | Rank | Per Capita Income |
| Trinidadians and Tobagonians | 9.5 /100 | #218 | Tragic $41,655 |
| Puget Sound Salish | 8.1 /100 | #219 | Tragic $41,495 |
| Immigrants | Barbados | 7.9 /100 | #220 | Tragic $41,478 |
| Immigrants | Trinidad and Tobago | 7.9 /100 | #221 | Tragic $41,476 |
| Immigrants | Iraq | 7.1 /100 | #222 | Tragic $41,365 |
| Immigrants | Cameroon | 6.8 /100 | #223 | Tragic $41,334 |
| Immigrants | St. Vincent and the Grenadines | 6.4 /100 | #224 | Tragic $41,270 |
| West Indians | 6.0 /100 | #225 | Tragic $41,217 |
| Immigrants | Ecuador | 5.9 /100 | #226 | Tragic $41,195 |
| Immigrants | Ghana | 5.5 /100 | #227 | Tragic $41,131 |
| Immigrants | Grenada | 5.5 /100 | #228 | Tragic $41,123 |
| Nigerians | 4.9 /100 | #229 | Tragic $41,026 |
| Native Hawaiians | 4.9 /100 | #230 | Tragic $41,017 |
| Senegalese | 4.8 /100 | #231 | Tragic $41,000 |
| Guyanese | 4.5 /100 | #232 | Tragic $40,949 |