Yakama vs Immigrants from Switzerland Per Capita Income
COMPARE
Yakama
Immigrants from Switzerland
Per Capita Income
Per Capita Income Comparison
Yakama
Immigrants from Switzerland
$33,009
PER CAPITA INCOME
0.0/ 100
METRIC RATING
336th/ 347
METRIC RANK
$54,866
PER CAPITA INCOME
100.0/ 100
METRIC RATING
16th/ 347
METRIC RANK
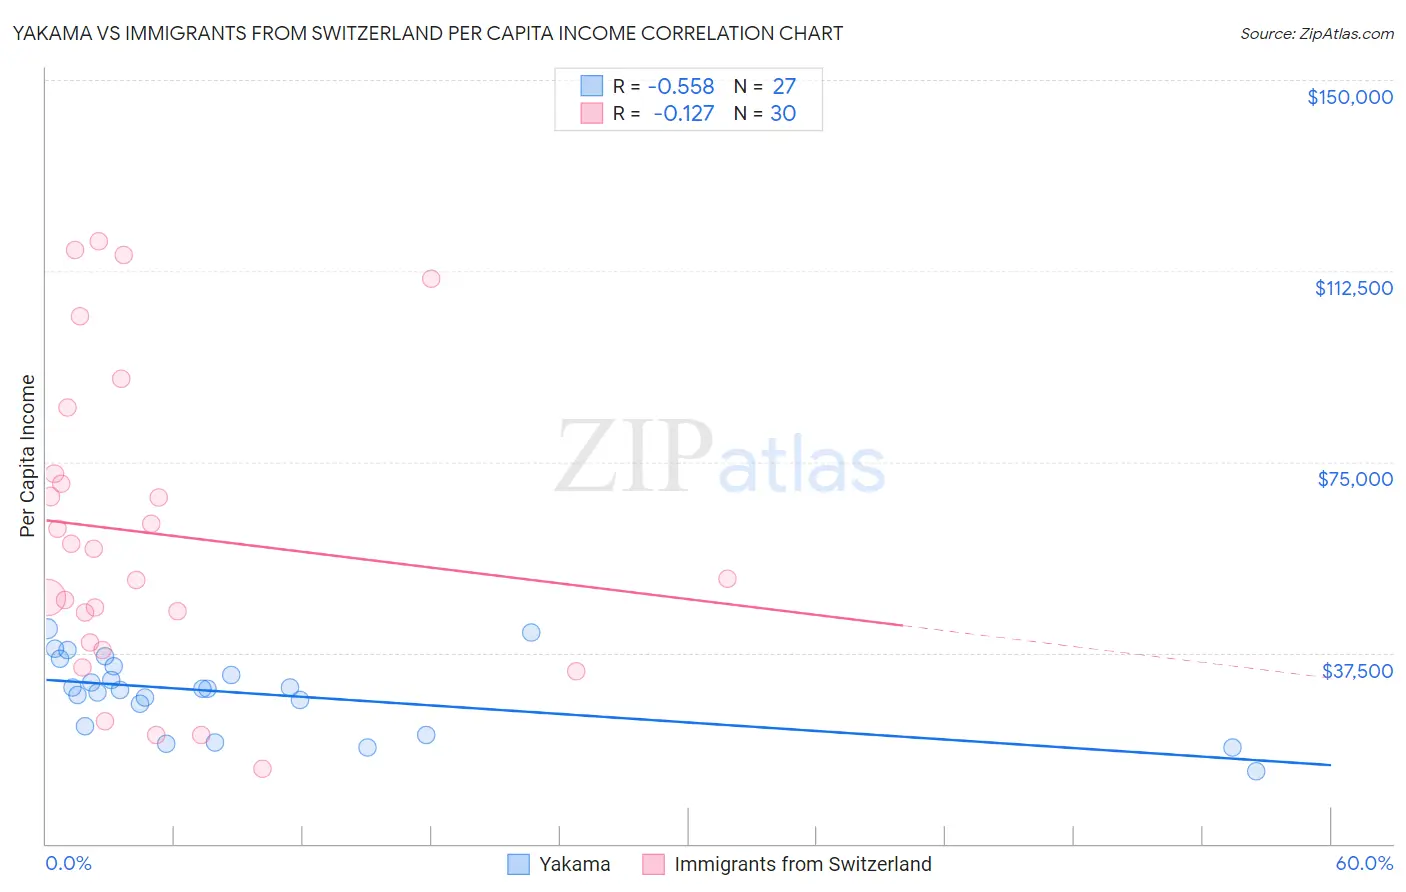
Yakama vs Immigrants from Switzerland Per Capita Income Correlation Chart
The statistical analysis conducted on geographies consisting of 19,923,144 people shows a substantial negative correlation between the proportion of Yakama and per capita income in the United States with a correlation coefficient (R) of -0.558 and weighted average of $33,009. Similarly, the statistical analysis conducted on geographies consisting of 148,083,583 people shows a poor negative correlation between the proportion of Immigrants from Switzerland and per capita income in the United States with a correlation coefficient (R) of -0.127 and weighted average of $54,866, a difference of 66.2%.
Per Capita Income Correlation Summary
| Measurement | Yakama | Immigrants from Switzerland |
| Minimum | $14,175 | $14,801 |
| Maximum | $42,131 | $118,438 |
| Range | $27,956 | $103,637 |
| Mean | $29,512 | $60,936 |
| Median | $30,514 | $54,944 |
| Interquartile 25% (IQ1) | $23,165 | $39,569 |
| Interquartile 75% (IQ3) | $34,761 | $72,692 |
| Interquartile Range (IQR) | $11,597 | $33,123 |
| Standard Deviation (Sample) | $7,251 | $29,867 |
| Standard Deviation (Population) | $7,116 | $29,365 |
Similar Demographics by Per Capita Income
Demographics Similar to Yakama by Per Capita Income
In terms of per capita income, the demographic groups most similar to Yakama are Houma ($32,996, a difference of 0.040%), Yuman ($33,236, a difference of 0.69%), Native/Alaskan ($33,279, a difference of 0.82%), Arapaho ($32,345, a difference of 2.1%), and Immigrants from Yemen ($33,696, a difference of 2.1%).
| Demographics | Rating | Rank | Per Capita Income |
| Mexicans | 0.0 /100 | #329 | Tragic $34,559 |
| Spanish American Indians | 0.0 /100 | #330 | Tragic $34,195 |
| Immigrants | Mexico | 0.0 /100 | #331 | Tragic $33,931 |
| Sioux | 0.0 /100 | #332 | Tragic $33,921 |
| Immigrants | Yemen | 0.0 /100 | #333 | Tragic $33,696 |
| Natives/Alaskans | 0.0 /100 | #334 | Tragic $33,279 |
| Yuman | 0.0 /100 | #335 | Tragic $33,236 |
| Yakama | 0.0 /100 | #336 | Tragic $33,009 |
| Houma | 0.0 /100 | #337 | Tragic $32,996 |
| Arapaho | 0.0 /100 | #338 | Tragic $32,345 |
| Pueblo | 0.0 /100 | #339 | Tragic $32,012 |
| Crow | 0.0 /100 | #340 | Tragic $31,729 |
| Puerto Ricans | 0.0 /100 | #341 | Tragic $31,268 |
| Hopi | 0.0 /100 | #342 | Tragic $31,177 |
| Pima | 0.0 /100 | #343 | Tragic $30,644 |
Demographics Similar to Immigrants from Switzerland by Per Capita Income
In terms of per capita income, the demographic groups most similar to Immigrants from Switzerland are Cypriot ($54,899, a difference of 0.060%), Immigrants from Belgium ($55,082, a difference of 0.39%), Immigrants from France ($54,557, a difference of 0.57%), Immigrants from India ($55,268, a difference of 0.73%), and Thai ($54,307, a difference of 1.0%).
| Demographics | Rating | Rank | Per Capita Income |
| Immigrants | Ireland | 100.0 /100 | #9 | Exceptional $56,584 |
| Okinawans | 100.0 /100 | #10 | Exceptional $55,817 |
| Eastern Europeans | 100.0 /100 | #11 | Exceptional $55,780 |
| Immigrants | Sweden | 100.0 /100 | #12 | Exceptional $55,582 |
| Immigrants | India | 100.0 /100 | #13 | Exceptional $55,268 |
| Immigrants | Belgium | 100.0 /100 | #14 | Exceptional $55,082 |
| Cypriots | 100.0 /100 | #15 | Exceptional $54,899 |
| Immigrants | Switzerland | 100.0 /100 | #16 | Exceptional $54,866 |
| Immigrants | France | 100.0 /100 | #17 | Exceptional $54,557 |
| Thais | 100.0 /100 | #18 | Exceptional $54,307 |
| Immigrants | China | 100.0 /100 | #19 | Exceptional $54,264 |
| Soviet Union | 100.0 /100 | #20 | Exceptional $54,202 |
| Immigrants | Northern Europe | 100.0 /100 | #21 | Exceptional $54,159 |
| Indians (Asian) | 100.0 /100 | #22 | Exceptional $53,874 |
| Immigrants | Eastern Asia | 100.0 /100 | #23 | Exceptional $53,806 |