Yakama vs U.S. Virgin Islander Per Capita Income
COMPARE
Yakama
U.S. Virgin Islander
Per Capita Income
Per Capita Income Comparison
Yakama
U.S. Virgin Islanders
$33,009
PER CAPITA INCOME
0.0/ 100
METRIC RATING
336th/ 347
METRIC RANK
$37,589
PER CAPITA INCOME
0.1/ 100
METRIC RATING
289th/ 347
METRIC RANK
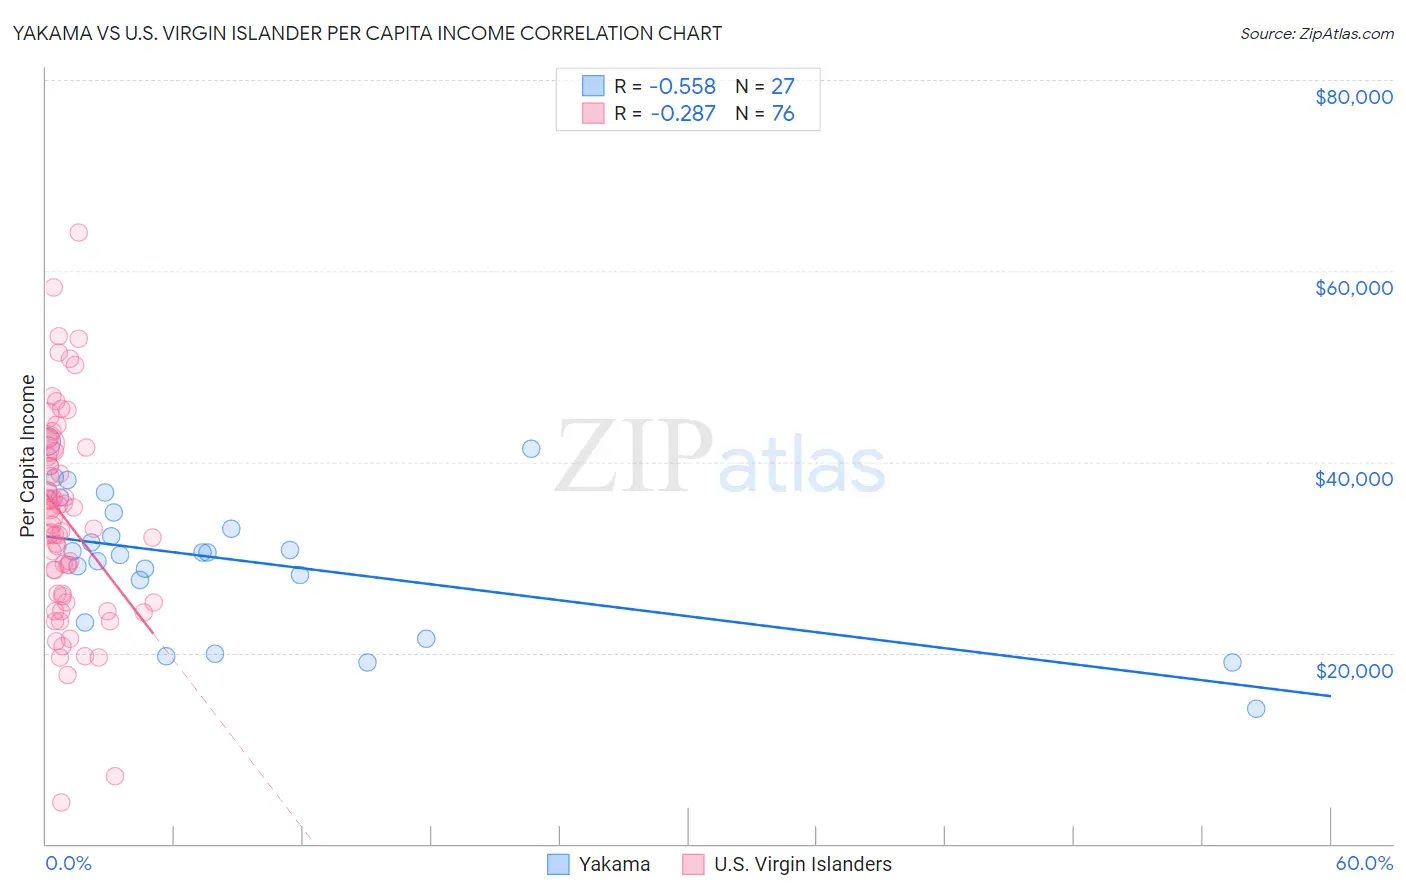
Yakama vs U.S. Virgin Islander Per Capita Income Correlation Chart
The statistical analysis conducted on geographies consisting of 19,923,144 people shows a substantial negative correlation between the proportion of Yakama and per capita income in the United States with a correlation coefficient (R) of -0.558 and weighted average of $33,009. Similarly, the statistical analysis conducted on geographies consisting of 87,529,979 people shows a weak negative correlation between the proportion of U.S. Virgin Islanders and per capita income in the United States with a correlation coefficient (R) of -0.287 and weighted average of $37,589, a difference of 13.9%.
Per Capita Income Correlation Summary
| Measurement | Yakama | U.S. Virgin Islander |
| Minimum | $14,175 | $4,326 |
| Maximum | $42,131 | $64,008 |
| Range | $27,956 | $59,682 |
| Mean | $29,512 | $34,023 |
| Median | $30,514 | $33,782 |
| Interquartile 25% (IQ1) | $23,165 | $26,044 |
| Interquartile 75% (IQ3) | $34,761 | $41,286 |
| Interquartile Range (IQR) | $11,597 | $15,242 |
| Standard Deviation (Sample) | $7,251 | $10,800 |
| Standard Deviation (Population) | $7,116 | $10,729 |
Similar Demographics by Per Capita Income
Demographics Similar to Yakama by Per Capita Income
In terms of per capita income, the demographic groups most similar to Yakama are Houma ($32,996, a difference of 0.040%), Yuman ($33,236, a difference of 0.69%), Native/Alaskan ($33,279, a difference of 0.82%), Arapaho ($32,345, a difference of 2.1%), and Immigrants from Yemen ($33,696, a difference of 2.1%).
| Demographics | Rating | Rank | Per Capita Income |
| Mexicans | 0.0 /100 | #329 | Tragic $34,559 |
| Spanish American Indians | 0.0 /100 | #330 | Tragic $34,195 |
| Immigrants | Mexico | 0.0 /100 | #331 | Tragic $33,931 |
| Sioux | 0.0 /100 | #332 | Tragic $33,921 |
| Immigrants | Yemen | 0.0 /100 | #333 | Tragic $33,696 |
| Natives/Alaskans | 0.0 /100 | #334 | Tragic $33,279 |
| Yuman | 0.0 /100 | #335 | Tragic $33,236 |
| Yakama | 0.0 /100 | #336 | Tragic $33,009 |
| Houma | 0.0 /100 | #337 | Tragic $32,996 |
| Arapaho | 0.0 /100 | #338 | Tragic $32,345 |
| Pueblo | 0.0 /100 | #339 | Tragic $32,012 |
| Crow | 0.0 /100 | #340 | Tragic $31,729 |
| Puerto Ricans | 0.0 /100 | #341 | Tragic $31,268 |
| Hopi | 0.0 /100 | #342 | Tragic $31,177 |
| Pima | 0.0 /100 | #343 | Tragic $30,644 |
Demographics Similar to U.S. Virgin Islanders by Per Capita Income
In terms of per capita income, the demographic groups most similar to U.S. Virgin Islanders are Immigrants from Guatemala ($37,550, a difference of 0.10%), Cajun ($37,527, a difference of 0.16%), Blackfeet ($37,695, a difference of 0.28%), Central American Indian ($37,699, a difference of 0.29%), and Dominican ($37,697, a difference of 0.29%).
| Demographics | Rating | Rank | Per Capita Income |
| Immigrants | Laos | 0.1 /100 | #282 | Tragic $37,857 |
| Pennsylvania Germans | 0.1 /100 | #283 | Tragic $37,842 |
| Africans | 0.1 /100 | #284 | Tragic $37,785 |
| Guatemalans | 0.1 /100 | #285 | Tragic $37,766 |
| Central American Indians | 0.1 /100 | #286 | Tragic $37,699 |
| Dominicans | 0.1 /100 | #287 | Tragic $37,697 |
| Blackfeet | 0.1 /100 | #288 | Tragic $37,695 |
| U.S. Virgin Islanders | 0.1 /100 | #289 | Tragic $37,589 |
| Immigrants | Guatemala | 0.1 /100 | #290 | Tragic $37,550 |
| Cajuns | 0.1 /100 | #291 | Tragic $37,527 |
| Immigrants | Micronesia | 0.1 /100 | #292 | Tragic $37,464 |
| Mexican American Indians | 0.1 /100 | #293 | Tragic $37,407 |
| Cubans | 0.1 /100 | #294 | Tragic $37,383 |
| Immigrants | Dominican Republic | 0.1 /100 | #295 | Tragic $37,306 |
| Indonesians | 0.1 /100 | #296 | Tragic $37,300 |