Yakama vs Bulgarian Per Capita Income
COMPARE
Yakama
Bulgarian
Per Capita Income
Per Capita Income Comparison
Yakama
Bulgarians
$33,009
PER CAPITA INCOME
0.0/ 100
METRIC RATING
336th/ 347
METRIC RANK
$50,906
PER CAPITA INCOME
100.0/ 100
METRIC RATING
47th/ 347
METRIC RANK
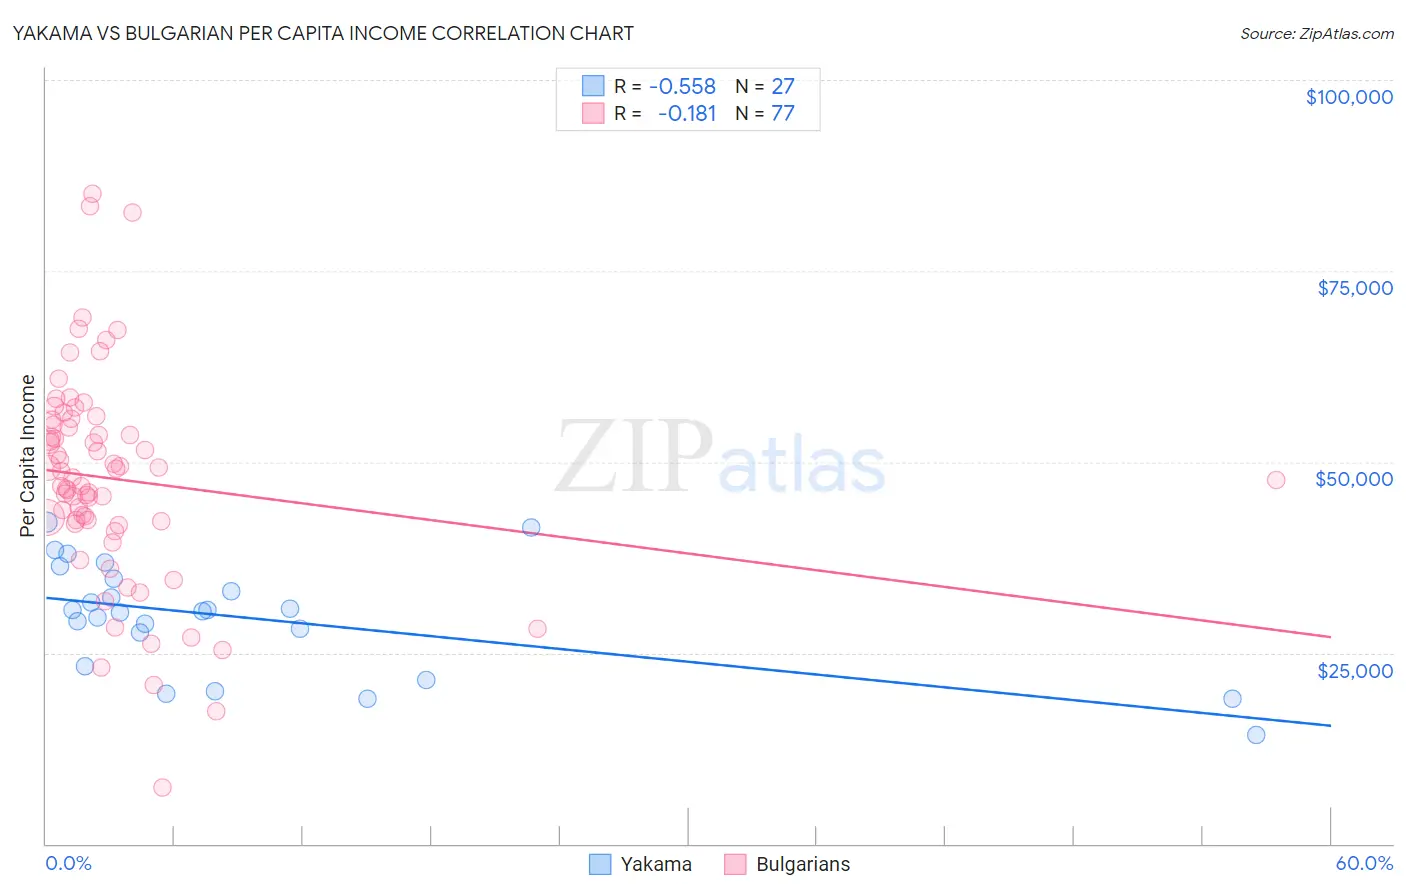
Yakama vs Bulgarian Per Capita Income Correlation Chart
The statistical analysis conducted on geographies consisting of 19,923,144 people shows a substantial negative correlation between the proportion of Yakama and per capita income in the United States with a correlation coefficient (R) of -0.558 and weighted average of $33,009. Similarly, the statistical analysis conducted on geographies consisting of 205,631,200 people shows a poor negative correlation between the proportion of Bulgarians and per capita income in the United States with a correlation coefficient (R) of -0.181 and weighted average of $50,906, a difference of 54.2%.
Per Capita Income Correlation Summary
| Measurement | Yakama | Bulgarian |
| Minimum | $14,175 | $7,295 |
| Maximum | $42,131 | $85,161 |
| Range | $27,956 | $77,866 |
| Mean | $29,512 | $47,737 |
| Median | $30,514 | $47,962 |
| Interquartile 25% (IQ1) | $23,165 | $42,061 |
| Interquartile 75% (IQ3) | $34,761 | $55,182 |
| Interquartile Range (IQR) | $11,597 | $13,122 |
| Standard Deviation (Sample) | $7,251 | $13,985 |
| Standard Deviation (Population) | $7,116 | $13,894 |
Similar Demographics by Per Capita Income
Demographics Similar to Yakama by Per Capita Income
In terms of per capita income, the demographic groups most similar to Yakama are Houma ($32,996, a difference of 0.040%), Yuman ($33,236, a difference of 0.69%), Native/Alaskan ($33,279, a difference of 0.82%), Arapaho ($32,345, a difference of 2.1%), and Immigrants from Yemen ($33,696, a difference of 2.1%).
| Demographics | Rating | Rank | Per Capita Income |
| Mexicans | 0.0 /100 | #329 | Tragic $34,559 |
| Spanish American Indians | 0.0 /100 | #330 | Tragic $34,195 |
| Immigrants | Mexico | 0.0 /100 | #331 | Tragic $33,931 |
| Sioux | 0.0 /100 | #332 | Tragic $33,921 |
| Immigrants | Yemen | 0.0 /100 | #333 | Tragic $33,696 |
| Natives/Alaskans | 0.0 /100 | #334 | Tragic $33,279 |
| Yuman | 0.0 /100 | #335 | Tragic $33,236 |
| Yakama | 0.0 /100 | #336 | Tragic $33,009 |
| Houma | 0.0 /100 | #337 | Tragic $32,996 |
| Arapaho | 0.0 /100 | #338 | Tragic $32,345 |
| Pueblo | 0.0 /100 | #339 | Tragic $32,012 |
| Crow | 0.0 /100 | #340 | Tragic $31,729 |
| Puerto Ricans | 0.0 /100 | #341 | Tragic $31,268 |
| Hopi | 0.0 /100 | #342 | Tragic $31,177 |
| Pima | 0.0 /100 | #343 | Tragic $30,644 |
Demographics Similar to Bulgarians by Per Capita Income
In terms of per capita income, the demographic groups most similar to Bulgarians are Immigrants from Latvia ($50,914, a difference of 0.020%), Immigrants from Spain ($50,933, a difference of 0.050%), Immigrants from Europe ($50,950, a difference of 0.090%), Immigrants from Serbia ($50,810, a difference of 0.19%), and New Zealander ($50,575, a difference of 0.65%).
| Demographics | Rating | Rank | Per Capita Income |
| Immigrants | Korea | 100.0 /100 | #40 | Exceptional $51,671 |
| Immigrants | South Africa | 100.0 /100 | #41 | Exceptional $51,465 |
| Immigrants | Turkey | 100.0 /100 | #42 | Exceptional $51,368 |
| Immigrants | Lithuania | 100.0 /100 | #43 | Exceptional $51,361 |
| Immigrants | Europe | 100.0 /100 | #44 | Exceptional $50,950 |
| Immigrants | Spain | 100.0 /100 | #45 | Exceptional $50,933 |
| Immigrants | Latvia | 100.0 /100 | #46 | Exceptional $50,914 |
| Bulgarians | 100.0 /100 | #47 | Exceptional $50,906 |
| Immigrants | Serbia | 100.0 /100 | #48 | Exceptional $50,810 |
| New Zealanders | 100.0 /100 | #49 | Exceptional $50,575 |
| Immigrants | Sri Lanka | 100.0 /100 | #50 | Exceptional $50,555 |
| Immigrants | Netherlands | 100.0 /100 | #51 | Exceptional $50,458 |
| Immigrants | Croatia | 99.9 /100 | #52 | Exceptional $50,417 |
| Paraguayans | 99.9 /100 | #53 | Exceptional $50,385 |
| Immigrants | Belarus | 99.9 /100 | #54 | Exceptional $50,303 |