Yakama vs Choctaw Divorced or Separated
COMPARE
Yakama
Choctaw
Divorced or Separated
Divorced or Separated Comparison
Yakama
Choctaw
12.3%
DIVORCED OR SEPARATED
7.8/ 100
METRIC RATING
230th/ 347
METRIC RANK
14.1%
DIVORCED OR SEPARATED
0.0/ 100
METRIC RATING
338th/ 347
METRIC RANK
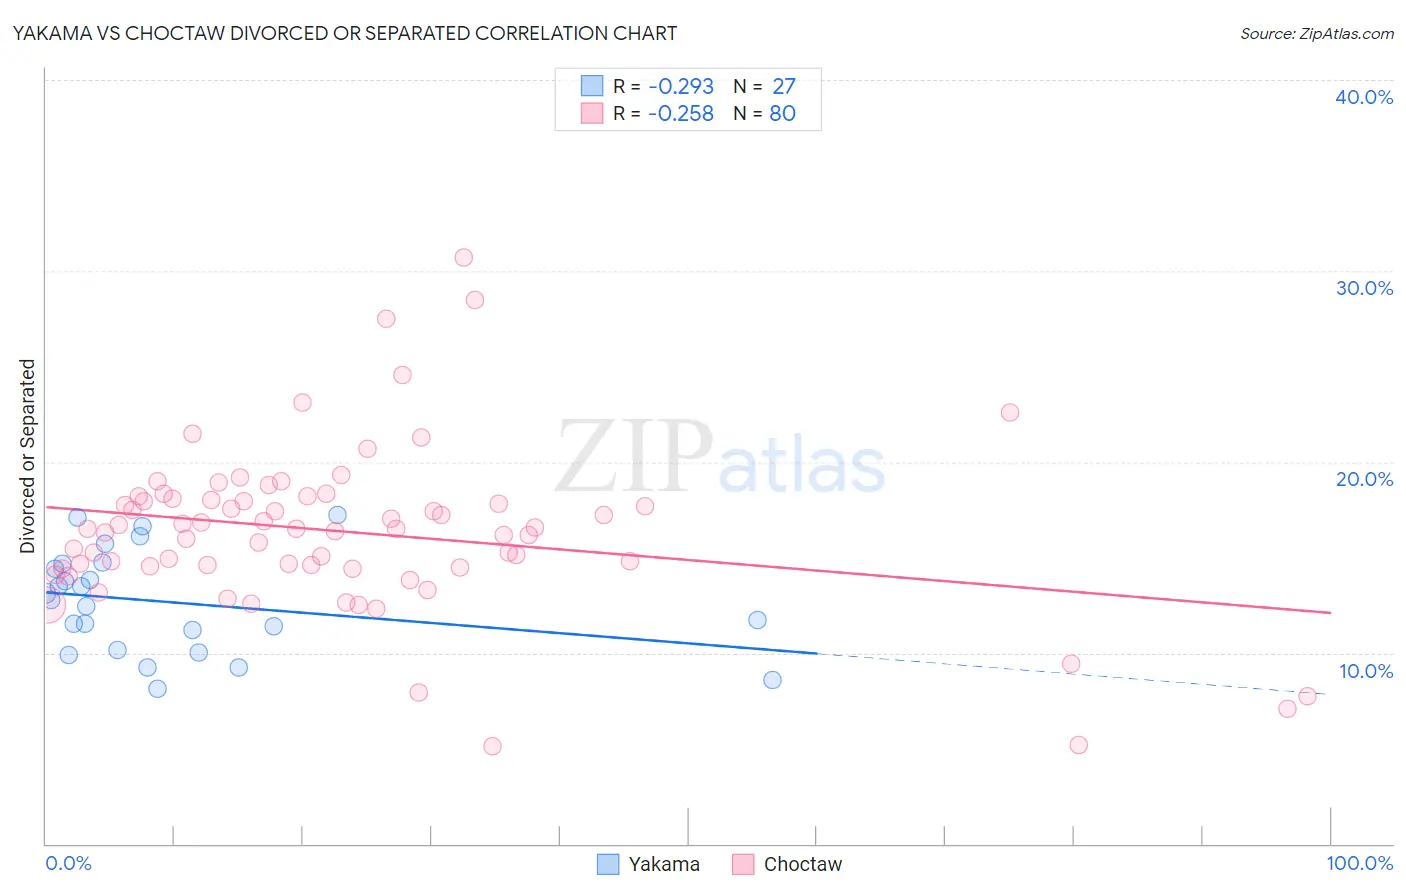
Yakama vs Choctaw Divorced or Separated Correlation Chart
The statistical analysis conducted on geographies consisting of 19,923,144 people shows a weak negative correlation between the proportion of Yakama and percentage of population currently divorced or separated in the United States with a correlation coefficient (R) of -0.293 and weighted average of 12.3%. Similarly, the statistical analysis conducted on geographies consisting of 269,698,992 people shows a weak negative correlation between the proportion of Choctaw and percentage of population currently divorced or separated in the United States with a correlation coefficient (R) of -0.258 and weighted average of 14.1%, a difference of 14.7%.
Divorced or Separated Correlation Summary
| Measurement | Yakama | Choctaw |
| Minimum | 8.1% | 5.1% |
| Maximum | 17.2% | 30.7% |
| Range | 9.1% | 25.6% |
| Mean | 12.7% | 16.3% |
| Median | 12.7% | 16.5% |
| Interquartile 25% (IQ1) | 10.1% | 14.5% |
| Interquartile 75% (IQ3) | 14.6% | 18.0% |
| Interquartile Range (IQR) | 4.5% | 3.5% |
| Standard Deviation (Sample) | 2.6% | 4.3% |
| Standard Deviation (Population) | 2.6% | 4.3% |
Similar Demographics by Divorced or Separated
Demographics Similar to Yakama by Divorced or Separated
In terms of divorced or separated, the demographic groups most similar to Yakama are Immigrants from Sudan (12.3%, a difference of 0.040%), Immigrants from Cameroon (12.3%, a difference of 0.060%), Hmong (12.3%, a difference of 0.11%), Yugoslavian (12.3%, a difference of 0.15%), and Immigrants from Western Africa (12.3%, a difference of 0.17%).
| Demographics | Rating | Rank | Divorced or Separated |
| Scandinavians | 10.4 /100 | #223 | Poor 12.3% |
| Immigrants | Azores | 9.7 /100 | #224 | Tragic 12.3% |
| Belgians | 9.7 /100 | #225 | Tragic 12.3% |
| Immigrants | Western Africa | 9.3 /100 | #226 | Tragic 12.3% |
| Hmong | 8.8 /100 | #227 | Tragic 12.3% |
| Immigrants | Cameroon | 8.3 /100 | #228 | Tragic 12.3% |
| Immigrants | Sudan | 8.2 /100 | #229 | Tragic 12.3% |
| Yakama | 7.8 /100 | #230 | Tragic 12.3% |
| Yugoslavians | 6.6 /100 | #231 | Tragic 12.3% |
| Canadians | 5.3 /100 | #232 | Tragic 12.4% |
| Malaysians | 4.8 /100 | #233 | Tragic 12.4% |
| West Indians | 4.4 /100 | #234 | Tragic 12.4% |
| Immigrants | Bosnia and Herzegovina | 4.3 /100 | #235 | Tragic 12.4% |
| Colombians | 4.2 /100 | #236 | Tragic 12.4% |
| Immigrants | Laos | 4.2 /100 | #237 | Tragic 12.4% |
Demographics Similar to Choctaw by Divorced or Separated
In terms of divorced or separated, the demographic groups most similar to Choctaw are Crow (14.1%, a difference of 0.31%), Colville (14.2%, a difference of 0.53%), Chickasaw (14.2%, a difference of 0.57%), Shoshone (14.0%, a difference of 0.60%), and Bahamian (14.2%, a difference of 0.77%).
| Demographics | Rating | Rank | Divorced or Separated |
| Blacks/African Americans | 0.0 /100 | #331 | Tragic 13.6% |
| Cherokee | 0.0 /100 | #332 | Tragic 13.7% |
| Puerto Ricans | 0.0 /100 | #333 | Tragic 13.9% |
| Immigrants | Bahamas | 0.0 /100 | #334 | Tragic 13.9% |
| Dutch West Indians | 0.0 /100 | #335 | Tragic 14.0% |
| Shoshone | 0.0 /100 | #336 | Tragic 14.0% |
| Crow | 0.0 /100 | #337 | Tragic 14.1% |
| Choctaw | 0.0 /100 | #338 | Tragic 14.1% |
| Colville | 0.0 /100 | #339 | Tragic 14.2% |
| Chickasaw | 0.0 /100 | #340 | Tragic 14.2% |
| Bahamians | 0.0 /100 | #341 | Tragic 14.2% |
| Seminole | 0.0 /100 | #342 | Tragic 14.3% |
| Creek | 0.0 /100 | #343 | Tragic 14.4% |
| Cubans | 0.0 /100 | #344 | Tragic 14.5% |
| Kiowa | 0.0 /100 | #345 | Tragic 14.5% |