Yakama vs Immigrants from North Macedonia Per Capita Income
COMPARE
Yakama
Immigrants from North Macedonia
Per Capita Income
Per Capita Income Comparison
Yakama
Immigrants from North Macedonia
$33,009
PER CAPITA INCOME
0.0/ 100
METRIC RATING
336th/ 347
METRIC RANK
$45,622
PER CAPITA INCOME
90.0/ 100
METRIC RATING
131st/ 347
METRIC RANK
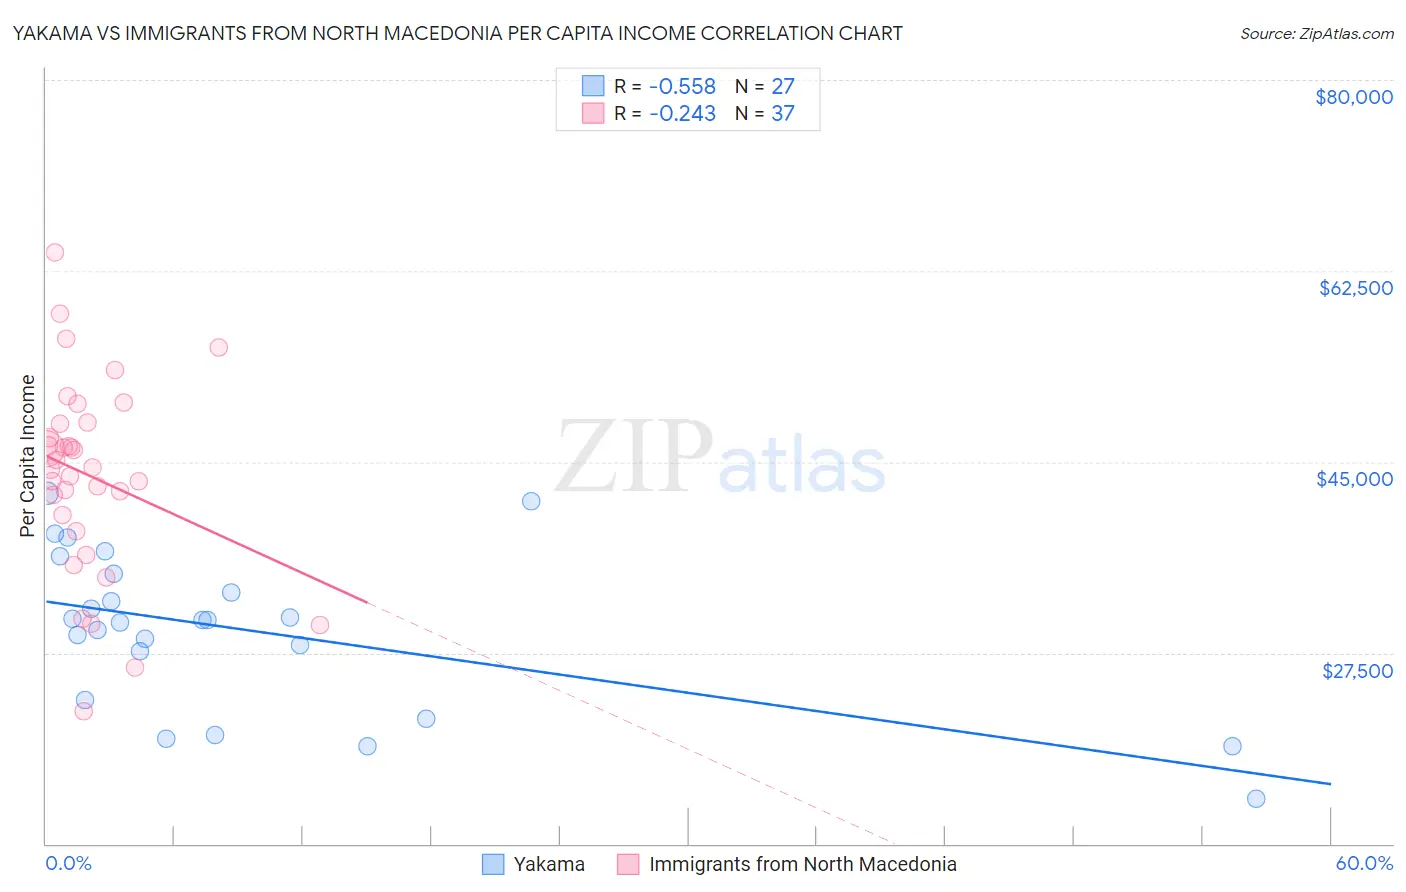
Yakama vs Immigrants from North Macedonia Per Capita Income Correlation Chart
The statistical analysis conducted on geographies consisting of 19,923,144 people shows a substantial negative correlation between the proportion of Yakama and per capita income in the United States with a correlation coefficient (R) of -0.558 and weighted average of $33,009. Similarly, the statistical analysis conducted on geographies consisting of 74,060,501 people shows a weak negative correlation between the proportion of Immigrants from North Macedonia and per capita income in the United States with a correlation coefficient (R) of -0.243 and weighted average of $45,622, a difference of 38.2%.
Per Capita Income Correlation Summary
| Measurement | Yakama | Immigrants from North Macedonia |
| Minimum | $14,175 | $22,118 |
| Maximum | $42,131 | $64,214 |
| Range | $27,956 | $42,096 |
| Mean | $29,512 | $43,782 |
| Median | $30,514 | $44,497 |
| Interquartile 25% (IQ1) | $23,165 | $39,397 |
| Interquartile 75% (IQ3) | $34,761 | $48,508 |
| Interquartile Range (IQR) | $11,597 | $9,111 |
| Standard Deviation (Sample) | $7,251 | $8,887 |
| Standard Deviation (Population) | $7,116 | $8,766 |
Similar Demographics by Per Capita Income
Demographics Similar to Yakama by Per Capita Income
In terms of per capita income, the demographic groups most similar to Yakama are Houma ($32,996, a difference of 0.040%), Yuman ($33,236, a difference of 0.69%), Native/Alaskan ($33,279, a difference of 0.82%), Arapaho ($32,345, a difference of 2.1%), and Immigrants from Yemen ($33,696, a difference of 2.1%).
| Demographics | Rating | Rank | Per Capita Income |
| Mexicans | 0.0 /100 | #329 | Tragic $34,559 |
| Spanish American Indians | 0.0 /100 | #330 | Tragic $34,195 |
| Immigrants | Mexico | 0.0 /100 | #331 | Tragic $33,931 |
| Sioux | 0.0 /100 | #332 | Tragic $33,921 |
| Immigrants | Yemen | 0.0 /100 | #333 | Tragic $33,696 |
| Natives/Alaskans | 0.0 /100 | #334 | Tragic $33,279 |
| Yuman | 0.0 /100 | #335 | Tragic $33,236 |
| Yakama | 0.0 /100 | #336 | Tragic $33,009 |
| Houma | 0.0 /100 | #337 | Tragic $32,996 |
| Arapaho | 0.0 /100 | #338 | Tragic $32,345 |
| Pueblo | 0.0 /100 | #339 | Tragic $32,012 |
| Crow | 0.0 /100 | #340 | Tragic $31,729 |
| Puerto Ricans | 0.0 /100 | #341 | Tragic $31,268 |
| Hopi | 0.0 /100 | #342 | Tragic $31,177 |
| Pima | 0.0 /100 | #343 | Tragic $30,644 |
Demographics Similar to Immigrants from North Macedonia by Per Capita Income
In terms of per capita income, the demographic groups most similar to Immigrants from North Macedonia are Jordanian ($45,605, a difference of 0.040%), Pakistani ($45,587, a difference of 0.080%), Luxembourger ($45,663, a difference of 0.090%), Arab ($45,662, a difference of 0.090%), and Slovene ($45,581, a difference of 0.090%).
| Demographics | Rating | Rank | Per Capita Income |
| Europeans | 92.0 /100 | #124 | Exceptional $45,836 |
| Zimbabweans | 91.7 /100 | #125 | Exceptional $45,804 |
| Palestinians | 91.6 /100 | #126 | Exceptional $45,790 |
| Immigrants | Germany | 91.3 /100 | #127 | Exceptional $45,751 |
| Swedes | 91.3 /100 | #128 | Exceptional $45,750 |
| Luxembourgers | 90.4 /100 | #129 | Exceptional $45,663 |
| Arabs | 90.4 /100 | #130 | Exceptional $45,662 |
| Immigrants | North Macedonia | 90.0 /100 | #131 | Exceptional $45,622 |
| Jordanians | 89.9 /100 | #132 | Excellent $45,605 |
| Pakistanis | 89.7 /100 | #133 | Excellent $45,587 |
| Slovenes | 89.6 /100 | #134 | Excellent $45,581 |
| Hungarians | 87.9 /100 | #135 | Excellent $45,426 |
| Immigrants | Oceania | 85.2 /100 | #136 | Excellent $45,220 |
| Immigrants | Syria | 85.2 /100 | #137 | Excellent $45,218 |
| Assyrians/Chaldeans/Syriacs | 84.8 /100 | #138 | Excellent $45,195 |