Slovene vs Iraqi Householder Income Over 65 years
COMPARE
Slovene
Iraqi
Householder Income Over 65 years
Householder Income Over 65 years Comparison
Slovenes
Iraqis
$60,241
HOUSEHOLDER INCOME OVER 65 YEARS
31.8/ 100
METRIC RATING
186th/ 347
METRIC RANK
$60,466
HOUSEHOLDER INCOME OVER 65 YEARS
37.2/ 100
METRIC RATING
184th/ 347
METRIC RANK
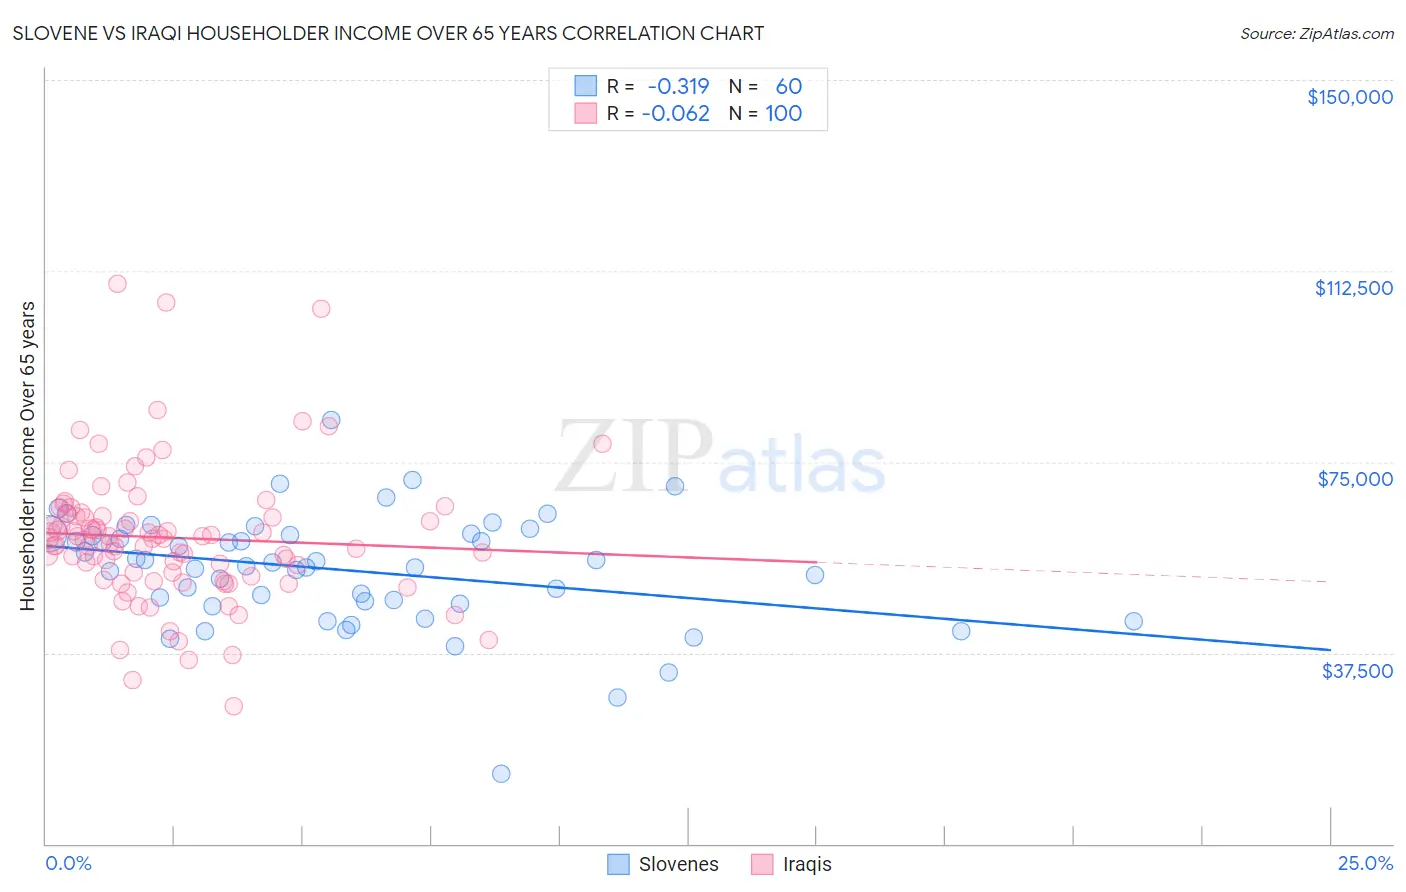
Slovene vs Iraqi Householder Income Over 65 years Correlation Chart
The statistical analysis conducted on geographies consisting of 260,915,590 people shows a mild negative correlation between the proportion of Slovenes and household income with householder over the age of 65 in the United States with a correlation coefficient (R) of -0.319 and weighted average of $60,241. Similarly, the statistical analysis conducted on geographies consisting of 170,476,894 people shows a slight negative correlation between the proportion of Iraqis and household income with householder over the age of 65 in the United States with a correlation coefficient (R) of -0.062 and weighted average of $60,466, a difference of 0.37%.
Householder Income Over 65 years Correlation Summary
| Measurement | Slovene | Iraqi |
| Minimum | $13,750 | $27,083 |
| Maximum | $83,108 | $110,088 |
| Range | $69,358 | $83,005 |
| Mean | $53,745 | $60,115 |
| Median | $54,879 | $59,854 |
| Interquartile 25% (IQ1) | $47,317 | $52,888 |
| Interquartile 75% (IQ3) | $60,731 | $64,237 |
| Interquartile Range (IQR) | $13,414 | $11,349 |
| Standard Deviation (Sample) | $11,247 | $13,499 |
| Standard Deviation (Population) | $11,153 | $13,432 |
Demographics Similar to Slovenes and Iraqis by Householder Income Over 65 years
In terms of householder income over 65 years, the demographic groups most similar to Slovenes are Albanian ($60,249, a difference of 0.010%), Immigrants from Thailand ($60,217, a difference of 0.040%), Immigrants from Eritrea ($60,096, a difference of 0.24%), Ghanaian ($60,043, a difference of 0.33%), and Kenyan ($60,514, a difference of 0.45%). Similarly, the demographic groups most similar to Iraqis are Kenyan ($60,514, a difference of 0.080%), Czechoslovakian ($60,581, a difference of 0.19%), Celtic ($60,608, a difference of 0.23%), Immigrants from Morocco ($60,647, a difference of 0.30%), and Welsh ($60,666, a difference of 0.33%).
| Demographics | Rating | Rank | Householder Income Over 65 years |
| Spaniards | 47.3 /100 | #175 | Average $60,866 |
| Spanish | 45.5 /100 | #176 | Average $60,795 |
| Alaska Natives | 44.3 /100 | #177 | Average $60,748 |
| Yup'ik | 43.7 /100 | #178 | Average $60,727 |
| Welsh | 42.2 /100 | #179 | Average $60,666 |
| Immigrants | Morocco | 41.7 /100 | #180 | Average $60,647 |
| Celtics | 40.7 /100 | #181 | Average $60,608 |
| Czechoslovakians | 40.0 /100 | #182 | Average $60,581 |
| Kenyans | 38.4 /100 | #183 | Fair $60,514 |
| Iraqis | 37.2 /100 | #184 | Fair $60,466 |
| Albanians | 32.0 /100 | #185 | Fair $60,249 |
| Slovenes | 31.8 /100 | #186 | Fair $60,241 |
| Immigrants | Thailand | 31.3 /100 | #187 | Fair $60,217 |
| Immigrants | Eritrea | 28.6 /100 | #188 | Fair $60,096 |
| Ghanaians | 27.5 /100 | #189 | Fair $60,043 |
| Puget Sound Salish | 25.3 /100 | #190 | Fair $59,934 |
| Belgians | 24.9 /100 | #191 | Fair $59,915 |
| South Americans | 23.8 /100 | #192 | Fair $59,854 |
| Immigrants | Costa Rica | 23.6 /100 | #193 | Fair $59,848 |
| Immigrants | Africa | 23.4 /100 | #194 | Fair $59,837 |
| Immigrants | Iraq | 23.2 /100 | #195 | Fair $59,824 |