Subsaharan African vs Iraqi Householder Income Over 65 years
COMPARE
Subsaharan African
Iraqi
Householder Income Over 65 years
Householder Income Over 65 years Comparison
Sub-Saharan Africans
Iraqis
$56,615
HOUSEHOLDER INCOME OVER 65 YEARS
1.0/ 100
METRIC RATING
240th/ 347
METRIC RANK
$60,466
HOUSEHOLDER INCOME OVER 65 YEARS
37.2/ 100
METRIC RATING
184th/ 347
METRIC RANK
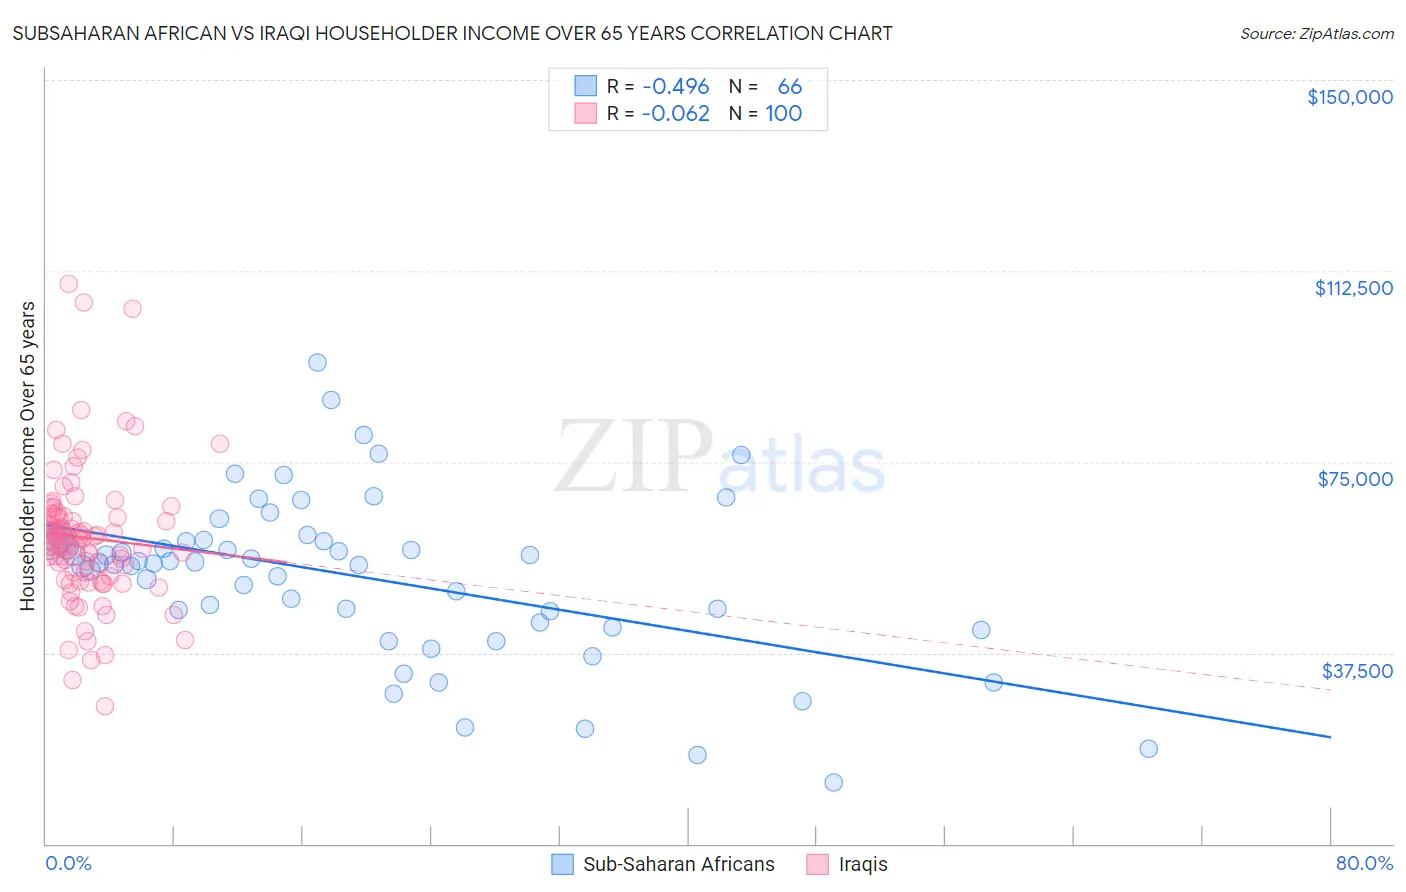
Subsaharan African vs Iraqi Householder Income Over 65 years Correlation Chart
The statistical analysis conducted on geographies consisting of 505,008,485 people shows a moderate negative correlation between the proportion of Sub-Saharan Africans and household income with householder over the age of 65 in the United States with a correlation coefficient (R) of -0.496 and weighted average of $56,615. Similarly, the statistical analysis conducted on geographies consisting of 170,476,894 people shows a slight negative correlation between the proportion of Iraqis and household income with householder over the age of 65 in the United States with a correlation coefficient (R) of -0.062 and weighted average of $60,466, a difference of 6.8%.
Householder Income Over 65 years Correlation Summary
| Measurement | Subsaharan African | Iraqi |
| Minimum | $12,049 | $27,083 |
| Maximum | $94,427 | $110,088 |
| Range | $82,378 | $83,005 |
| Mean | $52,341 | $60,115 |
| Median | $55,146 | $59,854 |
| Interquartile 25% (IQ1) | $43,507 | $52,888 |
| Interquartile 75% (IQ3) | $59,521 | $64,237 |
| Interquartile Range (IQR) | $16,014 | $11,349 |
| Standard Deviation (Sample) | $16,149 | $13,499 |
| Standard Deviation (Population) | $16,026 | $13,432 |
Similar Demographics by Householder Income Over 65 years
Demographics Similar to Sub-Saharan Africans by Householder Income Over 65 years
In terms of householder income over 65 years, the demographic groups most similar to Sub-Saharan Africans are Immigrants from Laos ($56,722, a difference of 0.19%), Immigrants from Guyana ($56,495, a difference of 0.21%), Fijian ($56,768, a difference of 0.27%), Yaqui ($56,417, a difference of 0.35%), and Guyanese ($56,351, a difference of 0.47%).
| Demographics | Rating | Rank | Householder Income Over 65 years |
| Immigrants | Western Africa | 1.7 /100 | #233 | Tragic $57,119 |
| Immigrants | Burma/Myanmar | 1.7 /100 | #234 | Tragic $57,114 |
| Spanish Americans | 1.6 /100 | #235 | Tragic $57,021 |
| Immigrants | Uruguay | 1.5 /100 | #236 | Tragic $56,975 |
| Immigrants | Panama | 1.5 /100 | #237 | Tragic $56,944 |
| Fijians | 1.2 /100 | #238 | Tragic $56,768 |
| Immigrants | Laos | 1.2 /100 | #239 | Tragic $56,722 |
| Sub-Saharan Africans | 1.0 /100 | #240 | Tragic $56,615 |
| Immigrants | Guyana | 0.9 /100 | #241 | Tragic $56,495 |
| Yaqui | 0.8 /100 | #242 | Tragic $56,417 |
| Guyanese | 0.8 /100 | #243 | Tragic $56,351 |
| Hmong | 0.8 /100 | #244 | Tragic $56,339 |
| Immigrants | Uzbekistan | 0.8 /100 | #245 | Tragic $56,331 |
| Central Americans | 0.8 /100 | #246 | Tragic $56,321 |
| Yakama | 0.7 /100 | #247 | Tragic $56,234 |
Demographics Similar to Iraqis by Householder Income Over 65 years
In terms of householder income over 65 years, the demographic groups most similar to Iraqis are Kenyan ($60,514, a difference of 0.080%), Czechoslovakian ($60,581, a difference of 0.19%), Celtic ($60,608, a difference of 0.23%), Immigrants from Morocco ($60,647, a difference of 0.30%), and Welsh ($60,666, a difference of 0.33%).
| Demographics | Rating | Rank | Householder Income Over 65 years |
| Alaska Natives | 44.3 /100 | #177 | Average $60,748 |
| Yup'ik | 43.7 /100 | #178 | Average $60,727 |
| Welsh | 42.2 /100 | #179 | Average $60,666 |
| Immigrants | Morocco | 41.7 /100 | #180 | Average $60,647 |
| Celtics | 40.7 /100 | #181 | Average $60,608 |
| Czechoslovakians | 40.0 /100 | #182 | Average $60,581 |
| Kenyans | 38.4 /100 | #183 | Fair $60,514 |
| Iraqis | 37.2 /100 | #184 | Fair $60,466 |
| Albanians | 32.0 /100 | #185 | Fair $60,249 |
| Slovenes | 31.8 /100 | #186 | Fair $60,241 |
| Immigrants | Thailand | 31.3 /100 | #187 | Fair $60,217 |
| Immigrants | Eritrea | 28.6 /100 | #188 | Fair $60,096 |
| Ghanaians | 27.5 /100 | #189 | Fair $60,043 |
| Puget Sound Salish | 25.3 /100 | #190 | Fair $59,934 |
| Belgians | 24.9 /100 | #191 | Fair $59,915 |