White/Caucasian vs Immigrants from Eritrea GED/Equivalency
COMPARE
White/Caucasian
Immigrants from Eritrea
GED/Equivalency
GED/Equivalency Comparison
Whites/Caucasians
Immigrants from Eritrea
86.2%
GED/EQUIVALENCY
72.2/ 100
METRIC RATING
157th/ 347
METRIC RANK
84.3%
GED/EQUIVALENCY
3.5/ 100
METRIC RATING
236th/ 347
METRIC RANK
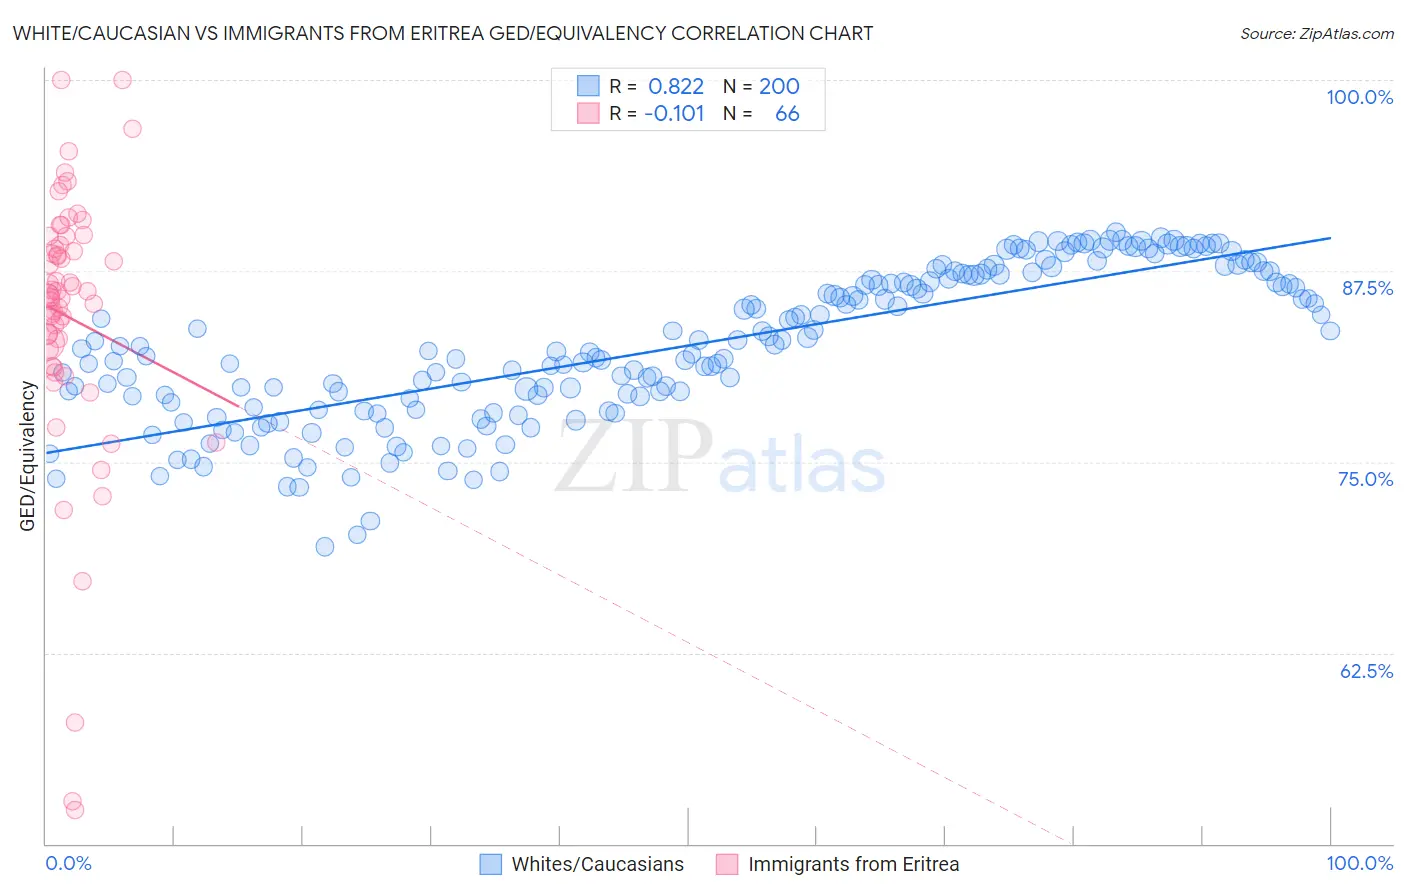
White/Caucasian vs Immigrants from Eritrea GED/Equivalency Correlation Chart
The statistical analysis conducted on geographies consisting of 585,240,437 people shows a very strong positive correlation between the proportion of Whites/Caucasians and percentage of population with at least ged/equivalency education in the United States with a correlation coefficient (R) of 0.822 and weighted average of 86.2%. Similarly, the statistical analysis conducted on geographies consisting of 104,852,788 people shows a poor negative correlation between the proportion of Immigrants from Eritrea and percentage of population with at least ged/equivalency education in the United States with a correlation coefficient (R) of -0.101 and weighted average of 84.3%, a difference of 2.2%.
GED/Equivalency Correlation Summary
| Measurement | White/Caucasian | Immigrants from Eritrea |
| Minimum | 69.4% | 52.2% |
| Maximum | 90.1% | 100.0% |
| Range | 20.6% | 47.8% |
| Mean | 82.6% | 84.5% |
| Median | 82.5% | 85.9% |
| Interquartile 25% (IQ1) | 79.0% | 82.4% |
| Interquartile 75% (IQ3) | 87.3% | 89.2% |
| Interquartile Range (IQR) | 8.3% | 6.8% |
| Standard Deviation (Sample) | 5.0% | 9.0% |
| Standard Deviation (Population) | 4.9% | 8.9% |
Similar Demographics by GED/Equivalency
Demographics Similar to Whites/Caucasians by GED/Equivalency
In terms of ged/equivalency, the demographic groups most similar to Whites/Caucasians are German Russian (86.2%, a difference of 0.0%), Immigrants from Kenya (86.2%, a difference of 0.010%), Immigrants from Nepal (86.2%, a difference of 0.030%), Immigrants from Morocco (86.1%, a difference of 0.070%), and Immigrants from Syria (86.1%, a difference of 0.070%).
| Demographics | Rating | Rank | GED/Equivalency |
| Immigrants | Western Asia | 78.8 /100 | #150 | Good 86.3% |
| Immigrants | Bosnia and Herzegovina | 77.9 /100 | #151 | Good 86.3% |
| Brazilians | 77.2 /100 | #152 | Good 86.3% |
| Kenyans | 76.6 /100 | #153 | Good 86.3% |
| Armenians | 76.4 /100 | #154 | Good 86.3% |
| Iraqis | 75.2 /100 | #155 | Good 86.2% |
| Immigrants | Nepal | 73.3 /100 | #156 | Good 86.2% |
| Whites/Caucasians | 72.2 /100 | #157 | Good 86.2% |
| German Russians | 72.1 /100 | #158 | Good 86.2% |
| Immigrants | Kenya | 71.8 /100 | #159 | Good 86.2% |
| Immigrants | Morocco | 69.5 /100 | #160 | Good 86.1% |
| Immigrants | Syria | 69.3 /100 | #161 | Good 86.1% |
| Immigrants | Iraq | 68.1 /100 | #162 | Good 86.1% |
| Ugandans | 66.3 /100 | #163 | Good 86.1% |
| Venezuelans | 65.5 /100 | #164 | Good 86.0% |
Demographics Similar to Immigrants from Eritrea by GED/Equivalency
In terms of ged/equivalency, the demographic groups most similar to Immigrants from Eritrea are Ghanaian (84.3%, a difference of 0.0%), Immigrants from Nigeria (84.3%, a difference of 0.020%), Subsaharan African (84.2%, a difference of 0.070%), Immigrants from South America (84.4%, a difference of 0.10%), and Immigrants from Panama (84.4%, a difference of 0.10%).
| Demographics | Rating | Rank | GED/Equivalency |
| Immigrants | Uruguay | 4.6 /100 | #229 | Tragic 84.4% |
| Immigrants | Colombia | 4.5 /100 | #230 | Tragic 84.4% |
| Immigrants | Middle Africa | 4.3 /100 | #231 | Tragic 84.4% |
| Immigrants | South America | 4.2 /100 | #232 | Tragic 84.4% |
| Immigrants | Panama | 4.1 /100 | #233 | Tragic 84.4% |
| Immigrants | Nigeria | 3.6 /100 | #234 | Tragic 84.3% |
| Ghanaians | 3.5 /100 | #235 | Tragic 84.3% |
| Immigrants | Eritrea | 3.5 /100 | #236 | Tragic 84.3% |
| Sub-Saharan Africans | 3.0 /100 | #237 | Tragic 84.2% |
| Immigrants | Peru | 2.7 /100 | #238 | Tragic 84.2% |
| Immigrants | Bahamas | 2.6 /100 | #239 | Tragic 84.2% |
| Immigrants | South Eastern Asia | 2.5 /100 | #240 | Tragic 84.1% |
| Senegalese | 1.9 /100 | #241 | Tragic 84.0% |
| Sri Lankans | 1.9 /100 | #242 | Tragic 84.0% |
| Cherokee | 1.3 /100 | #243 | Tragic 83.9% |