Iranian vs British Householder Income Over 65 years
COMPARE
Iranian
British
Householder Income Over 65 years
Householder Income Over 65 years Comparison
Iranians
British
$77,429
HOUSEHOLDER INCOME OVER 65 YEARS
100.0/ 100
METRIC RATING
2nd/ 347
METRIC RANK
$63,940
HOUSEHOLDER INCOME OVER 65 YEARS
95.7/ 100
METRIC RATING
103rd/ 347
METRIC RANK
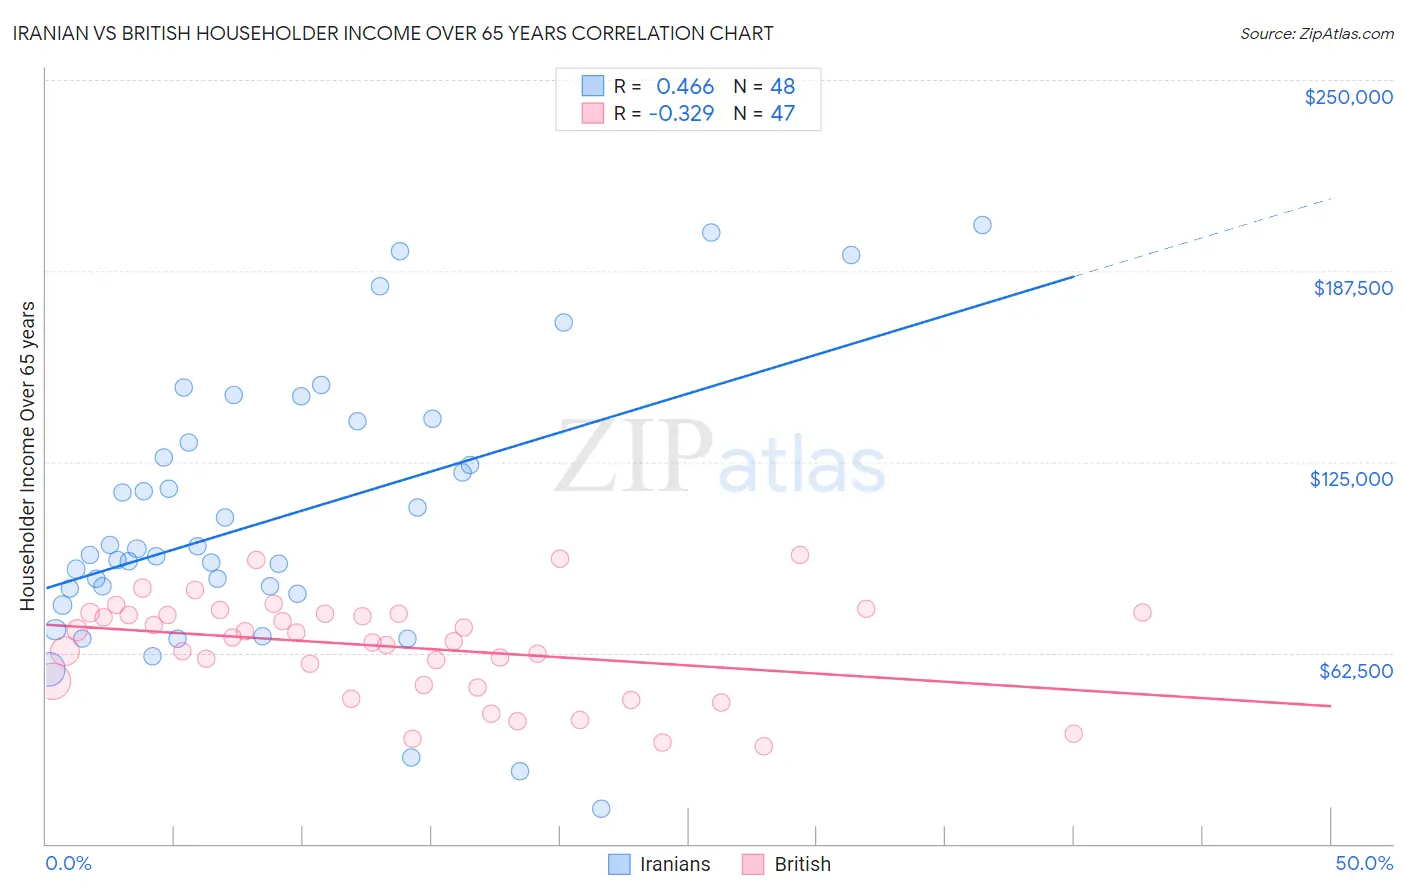
Iranian vs British Householder Income Over 65 years Correlation Chart
The statistical analysis conducted on geographies consisting of 316,043,836 people shows a moderate positive correlation between the proportion of Iranians and household income with householder over the age of 65 in the United States with a correlation coefficient (R) of 0.466 and weighted average of $77,429. Similarly, the statistical analysis conducted on geographies consisting of 528,237,222 people shows a mild negative correlation between the proportion of British and household income with householder over the age of 65 in the United States with a correlation coefficient (R) of -0.329 and weighted average of $63,940, a difference of 21.1%.
Householder Income Over 65 years Correlation Summary
| Measurement | Iranian | British |
| Minimum | $11,563 | $32,083 |
| Maximum | $202,500 | $94,602 |
| Range | $190,937 | $62,519 |
| Mean | $106,815 | $64,486 |
| Median | $95,602 | $67,398 |
| Interquartile 25% (IQ1) | $82,658 | $52,155 |
| Interquartile 75% (IQ3) | $134,972 | $75,312 |
| Interquartile Range (IQR) | $52,314 | $23,157 |
| Standard Deviation (Sample) | $44,529 | $16,132 |
| Standard Deviation (Population) | $44,062 | $15,959 |
Similar Demographics by Householder Income Over 65 years
Demographics Similar to Iranians by Householder Income Over 65 years
In terms of householder income over 65 years, the demographic groups most similar to Iranians are Chinese ($77,465, a difference of 0.050%), Immigrants from Taiwan ($77,051, a difference of 0.49%), Filipino ($76,686, a difference of 0.97%), Immigrants from Iran ($75,081, a difference of 3.1%), and Bolivian ($74,245, a difference of 4.3%).
| Demographics | Rating | Rank | Householder Income Over 65 years |
| Chinese | 100.0 /100 | #1 | Exceptional $77,465 |
| Iranians | 100.0 /100 | #2 | Exceptional $77,429 |
| Immigrants | Taiwan | 100.0 /100 | #3 | Exceptional $77,051 |
| Filipinos | 100.0 /100 | #4 | Exceptional $76,686 |
| Immigrants | Iran | 100.0 /100 | #5 | Exceptional $75,081 |
| Bolivians | 100.0 /100 | #6 | Exceptional $74,245 |
| Immigrants | Bolivia | 100.0 /100 | #7 | Exceptional $73,434 |
| Immigrants | Singapore | 100.0 /100 | #8 | Exceptional $72,963 |
| Immigrants | India | 100.0 /100 | #9 | Exceptional $72,804 |
| Bhutanese | 100.0 /100 | #10 | Exceptional $72,288 |
| Thais | 100.0 /100 | #11 | Exceptional $72,099 |
| Cypriots | 100.0 /100 | #12 | Exceptional $71,714 |
| Immigrants | Hong Kong | 100.0 /100 | #13 | Exceptional $71,567 |
| Burmese | 100.0 /100 | #14 | Exceptional $71,139 |
| Native Hawaiians | 100.0 /100 | #15 | Exceptional $71,021 |
Demographics Similar to British by Householder Income Over 65 years
In terms of householder income over 65 years, the demographic groups most similar to British are Chilean ($63,957, a difference of 0.030%), Immigrants from Cameroon ($63,907, a difference of 0.050%), Italian ($63,885, a difference of 0.080%), Immigrants from Argentina ($63,885, a difference of 0.090%), and Pakistani ($63,844, a difference of 0.15%).
| Demographics | Rating | Rank | Householder Income Over 65 years |
| Immigrants | Hungary | 97.0 /100 | #96 | Exceptional $64,277 |
| Sri Lankans | 96.7 /100 | #97 | Exceptional $64,201 |
| Romanians | 96.5 /100 | #98 | Exceptional $64,142 |
| Assyrians/Chaldeans/Syriacs | 96.4 /100 | #99 | Exceptional $64,108 |
| Immigrants | South Eastern Asia | 96.3 /100 | #100 | Exceptional $64,089 |
| Immigrants | Italy | 96.2 /100 | #101 | Exceptional $64,065 |
| Chileans | 95.8 /100 | #102 | Exceptional $63,957 |
| British | 95.7 /100 | #103 | Exceptional $63,940 |
| Immigrants | Cameroon | 95.6 /100 | #104 | Exceptional $63,907 |
| Italians | 95.5 /100 | #105 | Exceptional $63,885 |
| Immigrants | Argentina | 95.5 /100 | #106 | Exceptional $63,885 |
| Pakistanis | 95.3 /100 | #107 | Exceptional $63,844 |
| Palestinians | 95.1 /100 | #108 | Exceptional $63,800 |
| Europeans | 95.0 /100 | #109 | Exceptional $63,779 |
| Immigrants | Zimbabwe | 94.3 /100 | #110 | Exceptional $63,643 |