European vs British Householder Income Over 65 years
COMPARE
European
British
Householder Income Over 65 years
Householder Income Over 65 years Comparison
Europeans
British
$63,779
HOUSEHOLDER INCOME OVER 65 YEARS
95.0/ 100
METRIC RATING
109th/ 347
METRIC RANK
$63,940
HOUSEHOLDER INCOME OVER 65 YEARS
95.7/ 100
METRIC RATING
103rd/ 347
METRIC RANK
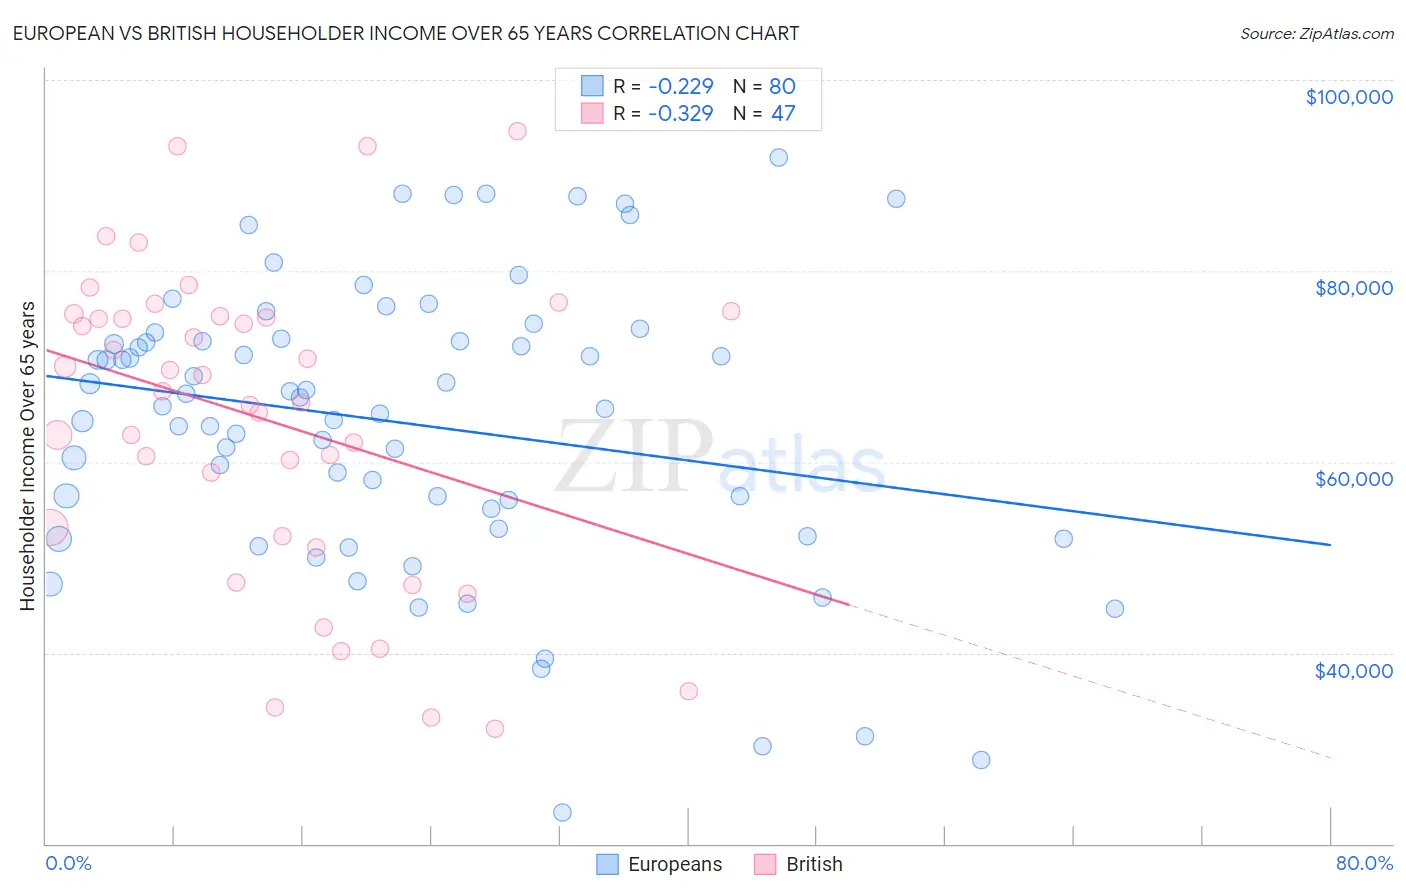
European vs British Householder Income Over 65 years Correlation Chart
The statistical analysis conducted on geographies consisting of 557,215,032 people shows a weak negative correlation between the proportion of Europeans and household income with householder over the age of 65 in the United States with a correlation coefficient (R) of -0.229 and weighted average of $63,779. Similarly, the statistical analysis conducted on geographies consisting of 528,237,222 people shows a mild negative correlation between the proportion of British and household income with householder over the age of 65 in the United States with a correlation coefficient (R) of -0.329 and weighted average of $63,940, a difference of 0.25%.
Householder Income Over 65 years Correlation Summary
| Measurement | European | British |
| Minimum | $23,269 | $32,083 |
| Maximum | $91,861 | $94,602 |
| Range | $68,592 | $62,519 |
| Mean | $64,098 | $64,486 |
| Median | $66,247 | $67,398 |
| Interquartile 25% (IQ1) | $54,019 | $52,155 |
| Interquartile 75% (IQ3) | $72,739 | $75,312 |
| Interquartile Range (IQR) | $18,720 | $23,157 |
| Standard Deviation (Sample) | $14,994 | $16,132 |
| Standard Deviation (Population) | $14,900 | $15,959 |
Demographics Similar to Europeans and British by Householder Income Over 65 years
In terms of householder income over 65 years, the demographic groups most similar to Europeans are Palestinian ($63,800, a difference of 0.030%), Pakistani ($63,844, a difference of 0.10%), Italian ($63,885, a difference of 0.17%), Immigrants from Argentina ($63,885, a difference of 0.17%), and Immigrants from Cameroon ($63,907, a difference of 0.20%). Similarly, the demographic groups most similar to British are Chilean ($63,957, a difference of 0.030%), Immigrants from Cameroon ($63,907, a difference of 0.050%), Italian ($63,885, a difference of 0.080%), Immigrants from Argentina ($63,885, a difference of 0.090%), and Pakistani ($63,844, a difference of 0.15%).
| Demographics | Rating | Rank | Householder Income Over 65 years |
| Immigrants | Hungary | 97.0 /100 | #96 | Exceptional $64,277 |
| Sri Lankans | 96.7 /100 | #97 | Exceptional $64,201 |
| Romanians | 96.5 /100 | #98 | Exceptional $64,142 |
| Assyrians/Chaldeans/Syriacs | 96.4 /100 | #99 | Exceptional $64,108 |
| Immigrants | South Eastern Asia | 96.3 /100 | #100 | Exceptional $64,089 |
| Immigrants | Italy | 96.2 /100 | #101 | Exceptional $64,065 |
| Chileans | 95.8 /100 | #102 | Exceptional $63,957 |
| British | 95.7 /100 | #103 | Exceptional $63,940 |
| Immigrants | Cameroon | 95.6 /100 | #104 | Exceptional $63,907 |
| Italians | 95.5 /100 | #105 | Exceptional $63,885 |
| Immigrants | Argentina | 95.5 /100 | #106 | Exceptional $63,885 |
| Pakistanis | 95.3 /100 | #107 | Exceptional $63,844 |
| Palestinians | 95.1 /100 | #108 | Exceptional $63,800 |
| Europeans | 95.0 /100 | #109 | Exceptional $63,779 |
| Immigrants | Zimbabwe | 94.3 /100 | #110 | Exceptional $63,643 |
| Immigrants | Spain | 93.7 /100 | #111 | Exceptional $63,540 |
| Syrians | 93.4 /100 | #112 | Exceptional $63,494 |
| Immigrants | Serbia | 92.7 /100 | #113 | Exceptional $63,387 |
| Immigrants | Saudi Arabia | 92.4 /100 | #114 | Exceptional $63,355 |
| Croatians | 91.4 /100 | #115 | Exceptional $63,225 |
| Guamanians/Chamorros | 91.1 /100 | #116 | Exceptional $63,187 |