Immigrants from Singapore vs Soviet Union Median Household Income
COMPARE
Immigrants from Singapore
Soviet Union
Median Household Income
Median Household Income Comparison
Immigrants from Singapore
Soviet Union
$110,428
MEDIAN HOUSEHOLD INCOME
100.0/ 100
METRIC RATING
6th/ 347
METRIC RANK
$95,098
MEDIAN HOUSEHOLD INCOME
99.8/ 100
METRIC RATING
58th/ 347
METRIC RANK
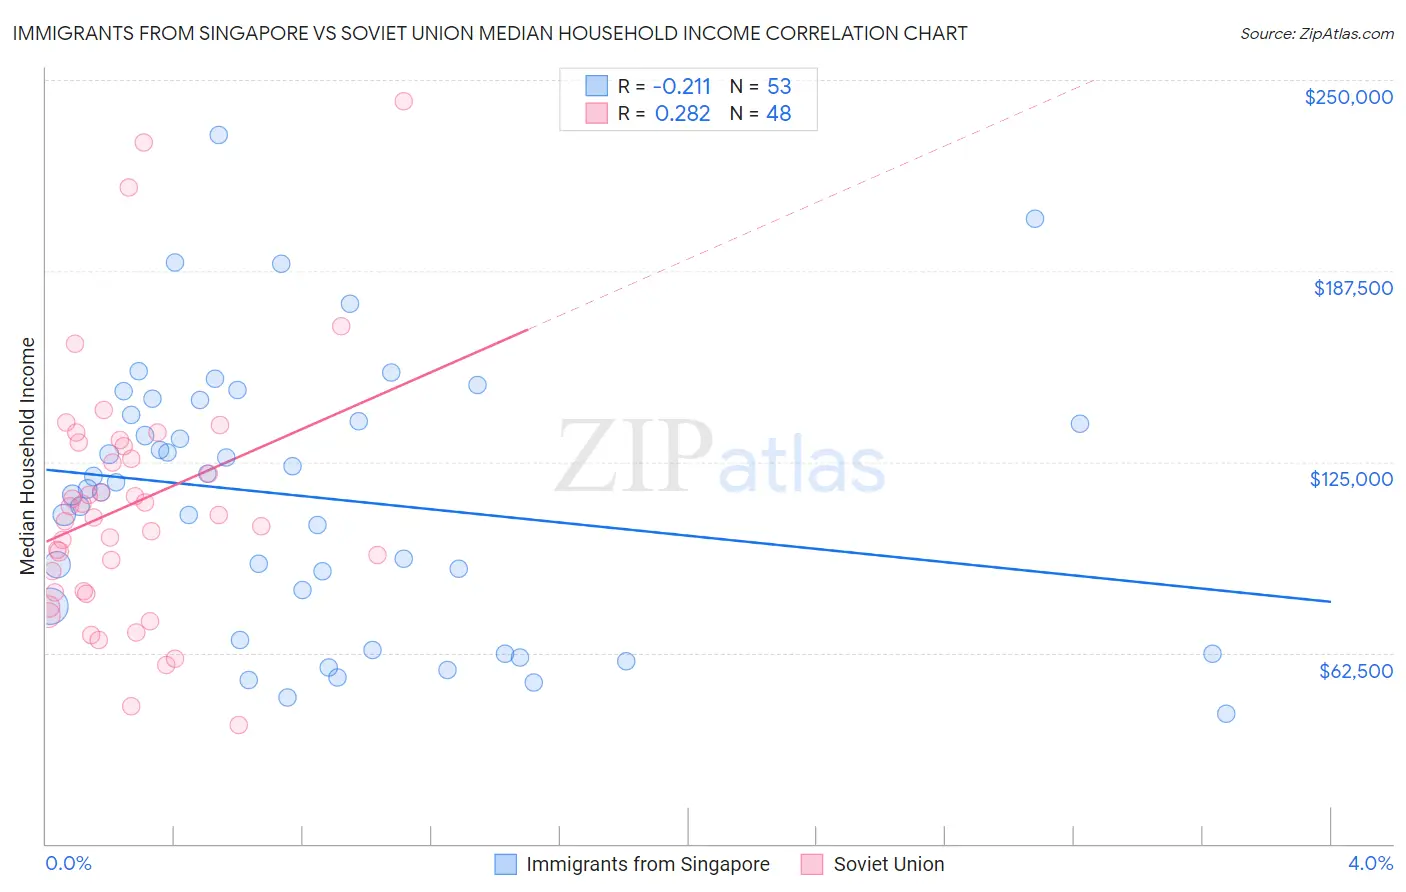
Immigrants from Singapore vs Soviet Union Median Household Income Correlation Chart
The statistical analysis conducted on geographies consisting of 137,415,639 people shows a weak negative correlation between the proportion of Immigrants from Singapore and median household income in the United States with a correlation coefficient (R) of -0.211 and weighted average of $110,428. Similarly, the statistical analysis conducted on geographies consisting of 43,509,359 people shows a weak positive correlation between the proportion of Soviet Union and median household income in the United States with a correlation coefficient (R) of 0.282 and weighted average of $95,098, a difference of 16.1%.
Median Household Income Correlation Summary
| Measurement | Immigrants from Singapore | Soviet Union |
| Minimum | $42,500 | $38,670 |
| Maximum | $232,046 | $243,125 |
| Range | $189,546 | $204,455 |
| Mean | $113,253 | $111,162 |
| Median | $116,276 | $107,165 |
| Interquartile 25% (IQ1) | $72,208 | $82,608 |
| Interquartile 75% (IQ3) | $142,877 | $130,577 |
| Interquartile Range (IQR) | $70,669 | $47,969 |
| Standard Deviation (Sample) | $43,740 | $41,880 |
| Standard Deviation (Population) | $43,325 | $41,441 |
Similar Demographics by Median Household Income
Demographics Similar to Immigrants from Singapore by Median Household Income
In terms of median household income, the demographic groups most similar to Immigrants from Singapore are Thai ($110,648, a difference of 0.20%), Iranian ($109,835, a difference of 0.54%), Immigrants from Hong Kong ($111,519, a difference of 0.99%), Immigrants from Iran ($108,055, a difference of 2.2%), and Immigrants from India ($113,009, a difference of 2.3%).
| Demographics | Rating | Rank | Median Household Income |
| Immigrants | Taiwan | 100.0 /100 | #1 | Exceptional $116,460 |
| Filipinos | 100.0 /100 | #2 | Exceptional $115,509 |
| Immigrants | India | 100.0 /100 | #3 | Exceptional $113,009 |
| Immigrants | Hong Kong | 100.0 /100 | #4 | Exceptional $111,519 |
| Thais | 100.0 /100 | #5 | Exceptional $110,648 |
| Immigrants | Singapore | 100.0 /100 | #6 | Exceptional $110,428 |
| Iranians | 100.0 /100 | #7 | Exceptional $109,835 |
| Immigrants | Iran | 100.0 /100 | #8 | Exceptional $108,055 |
| Okinawans | 100.0 /100 | #9 | Exceptional $106,624 |
| Immigrants | South Central Asia | 100.0 /100 | #10 | Exceptional $106,057 |
| Immigrants | China | 100.0 /100 | #11 | Exceptional $105,335 |
| Indians (Asian) | 100.0 /100 | #12 | Exceptional $105,262 |
| Immigrants | Eastern Asia | 100.0 /100 | #13 | Exceptional $104,796 |
| Immigrants | Ireland | 100.0 /100 | #14 | Exceptional $104,692 |
| Immigrants | Israel | 100.0 /100 | #15 | Exceptional $104,090 |
Demographics Similar to Soviet Union by Median Household Income
In terms of median household income, the demographic groups most similar to Soviet Union are New Zealander ($95,146, a difference of 0.050%), Immigrants from Europe ($95,032, a difference of 0.070%), Korean ($95,018, a difference of 0.080%), Laotian ($94,990, a difference of 0.11%), and Immigrants from Austria ($95,277, a difference of 0.19%).
| Demographics | Rating | Rank | Median Household Income |
| Estonians | 99.9 /100 | #51 | Exceptional $95,930 |
| Immigrants | South Africa | 99.9 /100 | #52 | Exceptional $95,800 |
| Paraguayans | 99.9 /100 | #53 | Exceptional $95,737 |
| Egyptians | 99.9 /100 | #54 | Exceptional $95,673 |
| Immigrants | Czechoslovakia | 99.9 /100 | #55 | Exceptional $95,319 |
| Immigrants | Austria | 99.9 /100 | #56 | Exceptional $95,277 |
| New Zealanders | 99.8 /100 | #57 | Exceptional $95,146 |
| Soviet Union | 99.8 /100 | #58 | Exceptional $95,098 |
| Immigrants | Europe | 99.8 /100 | #59 | Exceptional $95,032 |
| Koreans | 99.8 /100 | #60 | Exceptional $95,018 |
| Laotians | 99.8 /100 | #61 | Exceptional $94,990 |
| Immigrants | Norway | 99.8 /100 | #62 | Exceptional $94,846 |
| Greeks | 99.8 /100 | #63 | Exceptional $94,735 |
| Immigrants | Netherlands | 99.7 /100 | #64 | Exceptional $94,411 |
| Immigrants | Belarus | 99.7 /100 | #65 | Exceptional $94,399 |