Immigrants from Afghanistan vs Soviet Union Median Household Income
COMPARE
Immigrants from Afghanistan
Soviet Union
Median Household Income
Median Household Income Comparison
Immigrants from Afghanistan
Soviet Union
$93,375
MEDIAN HOUSEHOLD INCOME
99.5/ 100
METRIC RATING
77th/ 347
METRIC RANK
$95,098
MEDIAN HOUSEHOLD INCOME
99.8/ 100
METRIC RATING
58th/ 347
METRIC RANK
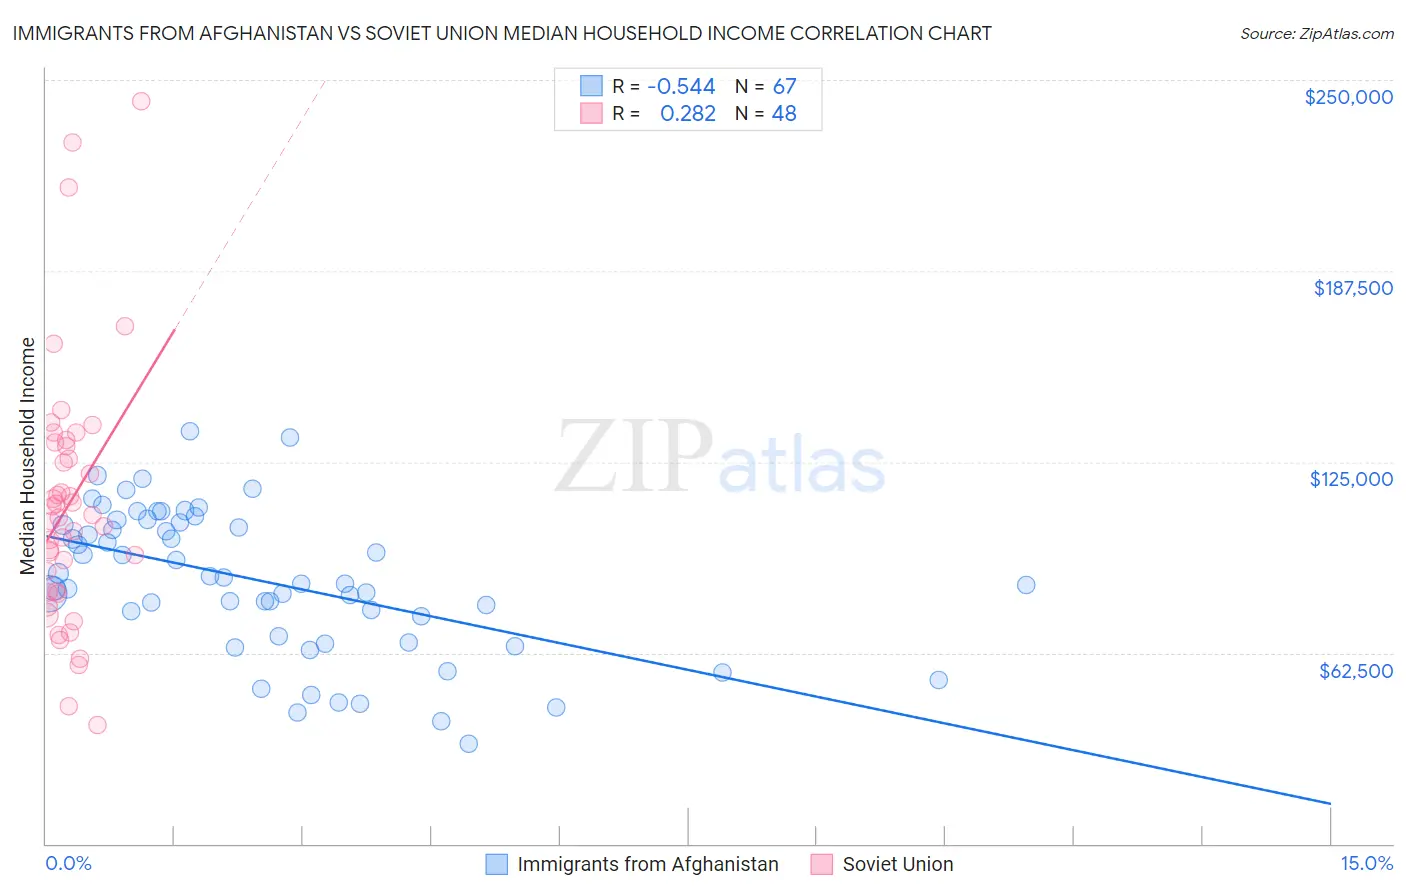
Immigrants from Afghanistan vs Soviet Union Median Household Income Correlation Chart
The statistical analysis conducted on geographies consisting of 147,635,708 people shows a substantial negative correlation between the proportion of Immigrants from Afghanistan and median household income in the United States with a correlation coefficient (R) of -0.544 and weighted average of $93,375. Similarly, the statistical analysis conducted on geographies consisting of 43,509,359 people shows a weak positive correlation between the proportion of Soviet Union and median household income in the United States with a correlation coefficient (R) of 0.282 and weighted average of $95,098, a difference of 1.8%.
Median Household Income Correlation Summary
| Measurement | Immigrants from Afghanistan | Soviet Union |
| Minimum | $32,569 | $38,670 |
| Maximum | $134,953 | $243,125 |
| Range | $102,384 | $204,455 |
| Mean | $86,066 | $111,162 |
| Median | $85,055 | $107,165 |
| Interquartile 25% (IQ1) | $67,813 | $82,608 |
| Interquartile 75% (IQ3) | $105,164 | $130,577 |
| Interquartile Range (IQR) | $37,351 | $47,969 |
| Standard Deviation (Sample) | $23,740 | $41,880 |
| Standard Deviation (Population) | $23,562 | $41,441 |
Demographics Similar to Immigrants from Afghanistan and Soviet Union by Median Household Income
In terms of median household income, the demographic groups most similar to Immigrants from Afghanistan are South African ($93,379, a difference of 0.0%), Immigrants from Italy ($93,465, a difference of 0.10%), Immigrants from Latvia ($93,602, a difference of 0.24%), Immigrants from Egypt ($93,700, a difference of 0.35%), and Lithuanian ($93,852, a difference of 0.51%). Similarly, the demographic groups most similar to Soviet Union are New Zealander ($95,146, a difference of 0.050%), Immigrants from Europe ($95,032, a difference of 0.070%), Korean ($95,018, a difference of 0.080%), Laotian ($94,990, a difference of 0.11%), and Immigrants from Norway ($94,846, a difference of 0.27%).
| Demographics | Rating | Rank | Median Household Income |
| New Zealanders | 99.8 /100 | #57 | Exceptional $95,146 |
| Soviet Union | 99.8 /100 | #58 | Exceptional $95,098 |
| Immigrants | Europe | 99.8 /100 | #59 | Exceptional $95,032 |
| Koreans | 99.8 /100 | #60 | Exceptional $95,018 |
| Laotians | 99.8 /100 | #61 | Exceptional $94,990 |
| Immigrants | Norway | 99.8 /100 | #62 | Exceptional $94,846 |
| Greeks | 99.8 /100 | #63 | Exceptional $94,735 |
| Immigrants | Netherlands | 99.7 /100 | #64 | Exceptional $94,411 |
| Immigrants | Belarus | 99.7 /100 | #65 | Exceptional $94,399 |
| Immigrants | Romania | 99.7 /100 | #66 | Exceptional $94,222 |
| Immigrants | Scotland | 99.7 /100 | #67 | Exceptional $94,091 |
| Mongolians | 99.7 /100 | #68 | Exceptional $93,971 |
| Argentineans | 99.7 /100 | #69 | Exceptional $93,960 |
| Immigrants | Fiji | 99.7 /100 | #70 | Exceptional $93,933 |
| Immigrants | Philippines | 99.6 /100 | #71 | Exceptional $93,899 |
| Lithuanians | 99.6 /100 | #72 | Exceptional $93,852 |
| Immigrants | Egypt | 99.6 /100 | #73 | Exceptional $93,700 |
| Immigrants | Latvia | 99.6 /100 | #74 | Exceptional $93,602 |
| Immigrants | Italy | 99.5 /100 | #75 | Exceptional $93,465 |
| South Africans | 99.5 /100 | #76 | Exceptional $93,379 |
| Immigrants | Afghanistan | 99.5 /100 | #77 | Exceptional $93,375 |