Maltese vs Immigrants from Kazakhstan Median Household Income
COMPARE
Maltese
Immigrants from Kazakhstan
Median Household Income
Median Household Income Comparison
Maltese
Immigrants from Kazakhstan
$97,015
MEDIAN HOUSEHOLD INCOME
100.0/ 100
METRIC RATING
40th/ 347
METRIC RANK
$91,015
MEDIAN HOUSEHOLD INCOME
97.8/ 100
METRIC RATING
104th/ 347
METRIC RANK
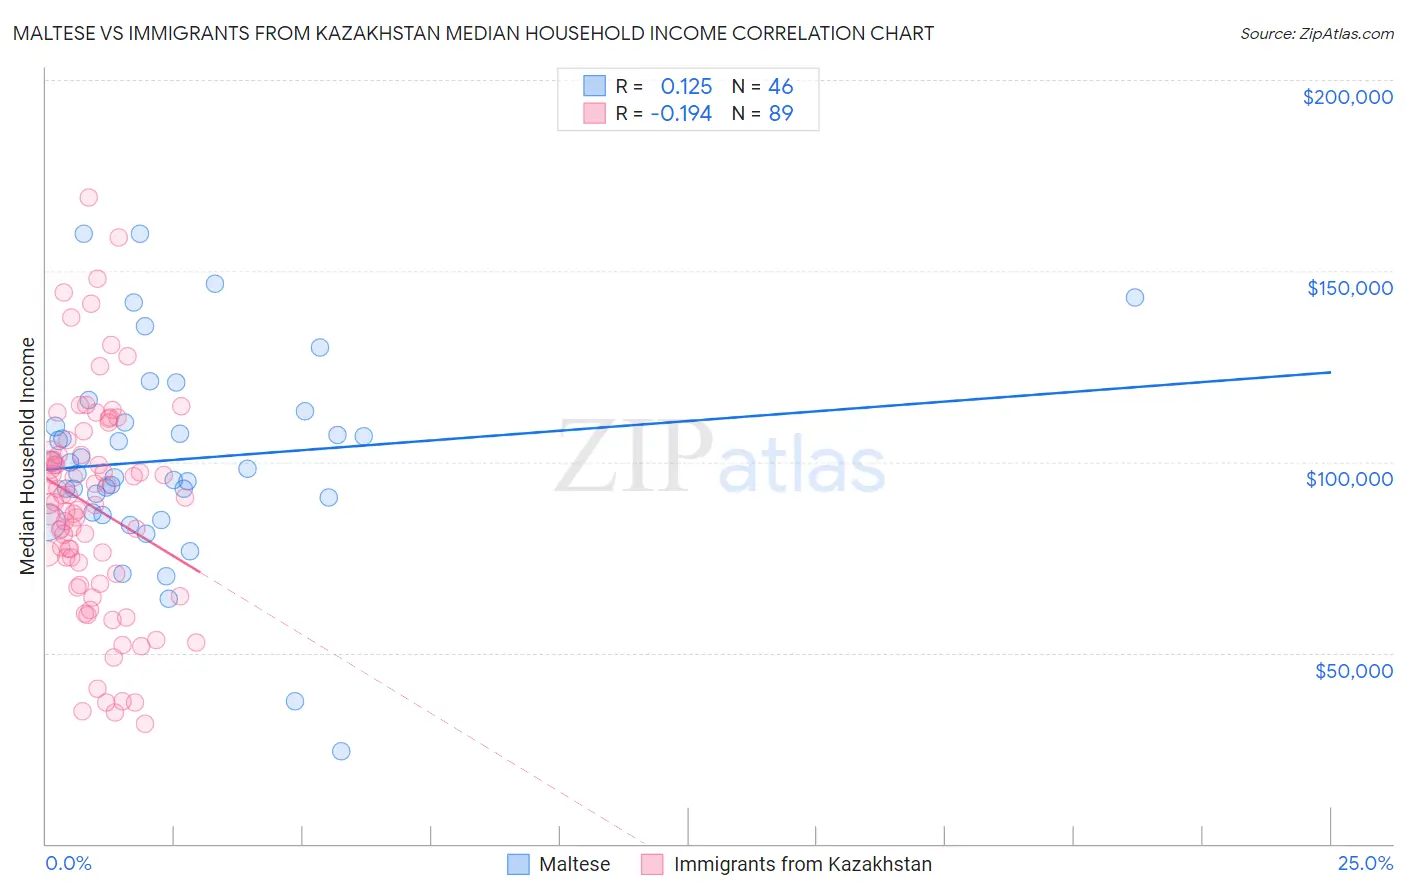
Maltese vs Immigrants from Kazakhstan Median Household Income Correlation Chart
The statistical analysis conducted on geographies consisting of 126,420,319 people shows a poor positive correlation between the proportion of Maltese and median household income in the United States with a correlation coefficient (R) of 0.125 and weighted average of $97,015. Similarly, the statistical analysis conducted on geographies consisting of 124,425,311 people shows a poor negative correlation between the proportion of Immigrants from Kazakhstan and median household income in the United States with a correlation coefficient (R) of -0.194 and weighted average of $91,015, a difference of 6.6%.
Median Household Income Correlation Summary
| Measurement | Maltese | Immigrants from Kazakhstan |
| Minimum | $24,250 | $31,369 |
| Maximum | $159,651 | $169,141 |
| Range | $135,401 | $137,772 |
| Mean | $100,571 | $88,237 |
| Median | $97,403 | $88,972 |
| Interquartile 25% (IQ1) | $86,626 | $69,524 |
| Interquartile 75% (IQ3) | $110,225 | $102,378 |
| Interquartile Range (IQR) | $23,599 | $32,854 |
| Standard Deviation (Sample) | $26,669 | $28,398 |
| Standard Deviation (Population) | $26,378 | $28,238 |
Similar Demographics by Median Household Income
Demographics Similar to Maltese by Median Household Income
In terms of median household income, the demographic groups most similar to Maltese are Afghan ($97,026, a difference of 0.010%), Immigrants from Turkey ($96,964, a difference of 0.050%), Immigrants from Lithuania ($96,836, a difference of 0.18%), Immigrants from France ($96,743, a difference of 0.28%), and Immigrants from Indonesia ($97,297, a difference of 0.29%).
| Demographics | Rating | Rank | Median Household Income |
| Chinese | 100.0 /100 | #33 | Exceptional $98,496 |
| Russians | 100.0 /100 | #34 | Exceptional $98,008 |
| Immigrants | Switzerland | 100.0 /100 | #35 | Exceptional $97,979 |
| Immigrants | Pakistan | 100.0 /100 | #36 | Exceptional $97,528 |
| Latvians | 100.0 /100 | #37 | Exceptional $97,311 |
| Immigrants | Indonesia | 100.0 /100 | #38 | Exceptional $97,297 |
| Afghans | 100.0 /100 | #39 | Exceptional $97,026 |
| Maltese | 100.0 /100 | #40 | Exceptional $97,015 |
| Immigrants | Turkey | 100.0 /100 | #41 | Exceptional $96,964 |
| Immigrants | Lithuania | 99.9 /100 | #42 | Exceptional $96,836 |
| Immigrants | France | 99.9 /100 | #43 | Exceptional $96,743 |
| Immigrants | Greece | 99.9 /100 | #44 | Exceptional $96,675 |
| Israelis | 99.9 /100 | #45 | Exceptional $96,552 |
| Australians | 99.9 /100 | #46 | Exceptional $96,490 |
| Immigrants | Russia | 99.9 /100 | #47 | Exceptional $96,378 |
Demographics Similar to Immigrants from Kazakhstan by Median Household Income
In terms of median household income, the demographic groups most similar to Immigrants from Kazakhstan are Immigrants from Ukraine ($91,124, a difference of 0.12%), Immigrants from Brazil ($90,907, a difference of 0.12%), Macedonian ($90,761, a difference of 0.28%), Austrian ($91,339, a difference of 0.36%), and Croatian ($90,685, a difference of 0.36%).
| Demographics | Rating | Rank | Median Household Income |
| Immigrants | Serbia | 98.6 /100 | #97 | Exceptional $91,730 |
| Immigrants | Southern Europe | 98.5 /100 | #98 | Exceptional $91,605 |
| Immigrants | South Eastern Asia | 98.4 /100 | #99 | Exceptional $91,541 |
| Ukrainians | 98.3 /100 | #100 | Exceptional $91,456 |
| Immigrants | Moldova | 98.3 /100 | #101 | Exceptional $91,446 |
| Austrians | 98.2 /100 | #102 | Exceptional $91,339 |
| Immigrants | Ukraine | 98.0 /100 | #103 | Exceptional $91,124 |
| Immigrants | Kazakhstan | 97.8 /100 | #104 | Exceptional $91,015 |
| Immigrants | Brazil | 97.7 /100 | #105 | Exceptional $90,907 |
| Macedonians | 97.4 /100 | #106 | Exceptional $90,761 |
| Croatians | 97.3 /100 | #107 | Exceptional $90,685 |
| Zimbabweans | 97.2 /100 | #108 | Exceptional $90,618 |
| Chileans | 97.2 /100 | #109 | Exceptional $90,605 |
| Palestinians | 97.1 /100 | #110 | Exceptional $90,574 |
| Immigrants | Poland | 97.1 /100 | #111 | Exceptional $90,549 |