Crow vs Immigrants from Kazakhstan Median Household Income
COMPARE
Crow
Immigrants from Kazakhstan
Median Household Income
Median Household Income Comparison
Crow
Immigrants from Kazakhstan
$63,681
MEDIAN HOUSEHOLD INCOME
0.0/ 100
METRIC RATING
341st/ 347
METRIC RANK
$91,015
MEDIAN HOUSEHOLD INCOME
97.8/ 100
METRIC RATING
104th/ 347
METRIC RANK
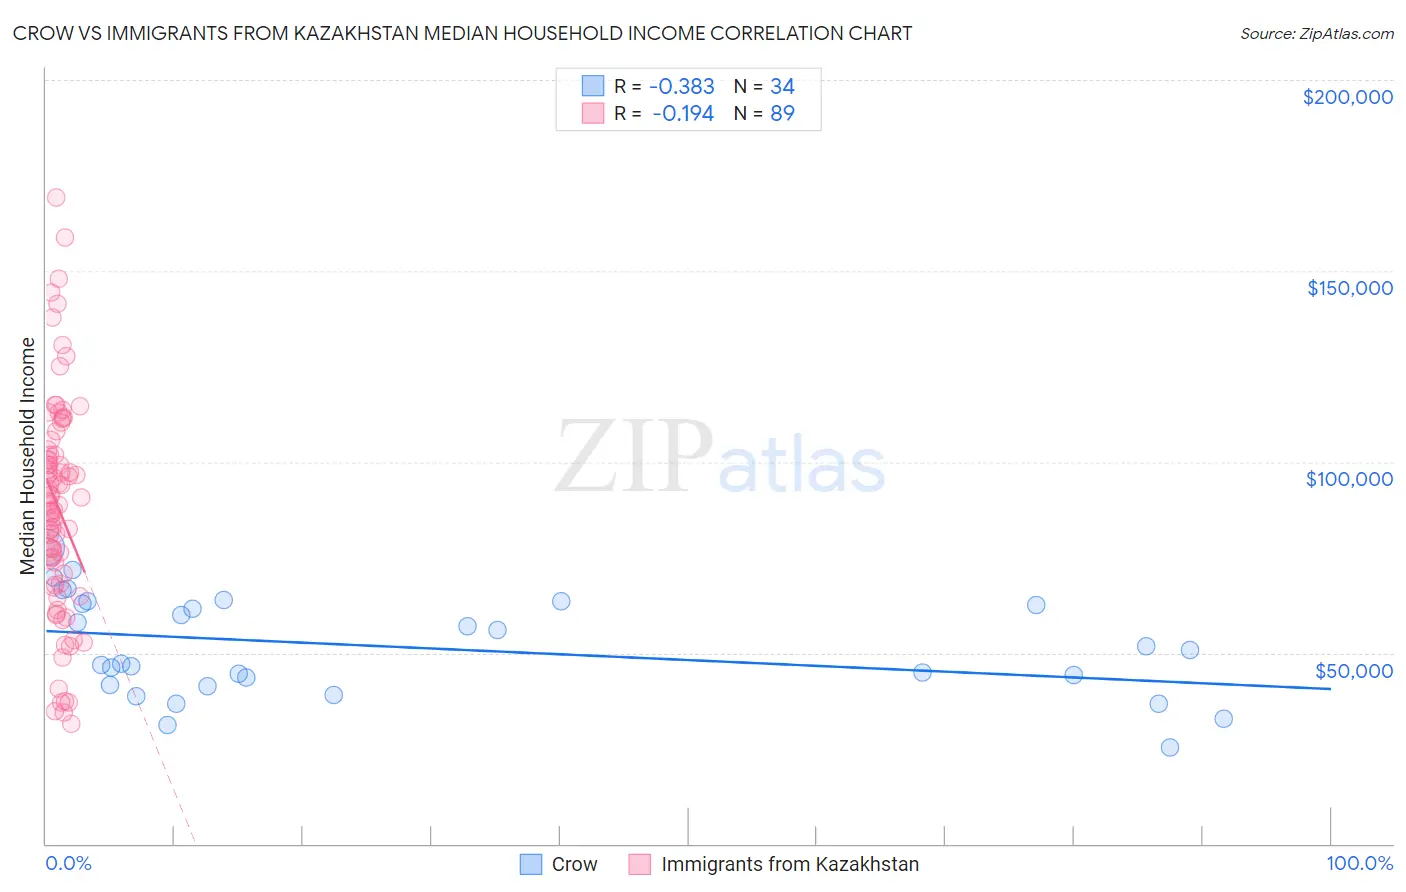
Crow vs Immigrants from Kazakhstan Median Household Income Correlation Chart
The statistical analysis conducted on geographies consisting of 59,197,360 people shows a mild negative correlation between the proportion of Crow and median household income in the United States with a correlation coefficient (R) of -0.383 and weighted average of $63,681. Similarly, the statistical analysis conducted on geographies consisting of 124,425,311 people shows a poor negative correlation between the proportion of Immigrants from Kazakhstan and median household income in the United States with a correlation coefficient (R) of -0.194 and weighted average of $91,015, a difference of 42.9%.
Median Household Income Correlation Summary
| Measurement | Crow | Immigrants from Kazakhstan |
| Minimum | $25,179 | $31,369 |
| Maximum | $77,725 | $169,141 |
| Range | $52,546 | $137,772 |
| Mean | $51,476 | $88,237 |
| Median | $48,948 | $88,972 |
| Interquartile 25% (IQ1) | $41,650 | $69,524 |
| Interquartile 75% (IQ3) | $62,906 | $102,378 |
| Interquartile Range (IQR) | $21,256 | $32,854 |
| Standard Deviation (Sample) | $12,984 | $28,398 |
| Standard Deviation (Population) | $12,792 | $28,238 |
Similar Demographics by Median Household Income
Demographics Similar to Crow by Median Household Income
In terms of median household income, the demographic groups most similar to Crow are Pima ($63,262, a difference of 0.66%), Pueblo ($64,692, a difference of 1.6%), Houma ($62,575, a difference of 1.8%), Hopi ($65,043, a difference of 2.1%), and Immigrants from Yemen ($65,194, a difference of 2.4%).
| Demographics | Rating | Rank | Median Household Income |
| Creek | 0.0 /100 | #333 | Tragic $67,715 |
| Blacks/African Americans | 0.0 /100 | #334 | Tragic $67,573 |
| Cheyenne | 0.0 /100 | #335 | Tragic $66,974 |
| Immigrants | Congo | 0.0 /100 | #336 | Tragic $66,768 |
| Kiowa | 0.0 /100 | #337 | Tragic $65,914 |
| Immigrants | Yemen | 0.0 /100 | #338 | Tragic $65,194 |
| Hopi | 0.0 /100 | #339 | Tragic $65,043 |
| Pueblo | 0.0 /100 | #340 | Tragic $64,692 |
| Crow | 0.0 /100 | #341 | Tragic $63,681 |
| Pima | 0.0 /100 | #342 | Tragic $63,262 |
| Houma | 0.0 /100 | #343 | Tragic $62,575 |
| Tohono O'odham | 0.0 /100 | #344 | Tragic $61,663 |
| Puerto Ricans | 0.0 /100 | #345 | Tragic $59,197 |
| Navajo | 0.0 /100 | #346 | Tragic $59,159 |
| Lumbee | 0.0 /100 | #347 | Tragic $54,644 |
Demographics Similar to Immigrants from Kazakhstan by Median Household Income
In terms of median household income, the demographic groups most similar to Immigrants from Kazakhstan are Immigrants from Ukraine ($91,124, a difference of 0.12%), Immigrants from Brazil ($90,907, a difference of 0.12%), Macedonian ($90,761, a difference of 0.28%), Austrian ($91,339, a difference of 0.36%), and Croatian ($90,685, a difference of 0.36%).
| Demographics | Rating | Rank | Median Household Income |
| Immigrants | Serbia | 98.6 /100 | #97 | Exceptional $91,730 |
| Immigrants | Southern Europe | 98.5 /100 | #98 | Exceptional $91,605 |
| Immigrants | South Eastern Asia | 98.4 /100 | #99 | Exceptional $91,541 |
| Ukrainians | 98.3 /100 | #100 | Exceptional $91,456 |
| Immigrants | Moldova | 98.3 /100 | #101 | Exceptional $91,446 |
| Austrians | 98.2 /100 | #102 | Exceptional $91,339 |
| Immigrants | Ukraine | 98.0 /100 | #103 | Exceptional $91,124 |
| Immigrants | Kazakhstan | 97.8 /100 | #104 | Exceptional $91,015 |
| Immigrants | Brazil | 97.7 /100 | #105 | Exceptional $90,907 |
| Macedonians | 97.4 /100 | #106 | Exceptional $90,761 |
| Croatians | 97.3 /100 | #107 | Exceptional $90,685 |
| Zimbabweans | 97.2 /100 | #108 | Exceptional $90,618 |
| Chileans | 97.2 /100 | #109 | Exceptional $90,605 |
| Palestinians | 97.1 /100 | #110 | Exceptional $90,574 |
| Immigrants | Poland | 97.1 /100 | #111 | Exceptional $90,549 |