Arapaho vs Immigrants from Dominican Republic Median Household Income
COMPARE
Arapaho
Immigrants from Dominican Republic
Median Household Income
Median Household Income Comparison
Arapaho
Immigrants from Dominican Republic
$67,965
MEDIAN HOUSEHOLD INCOME
0.0/ 100
METRIC RATING
330th/ 347
METRIC RANK
$70,208
MEDIAN HOUSEHOLD INCOME
0.0/ 100
METRIC RATING
319th/ 347
METRIC RANK
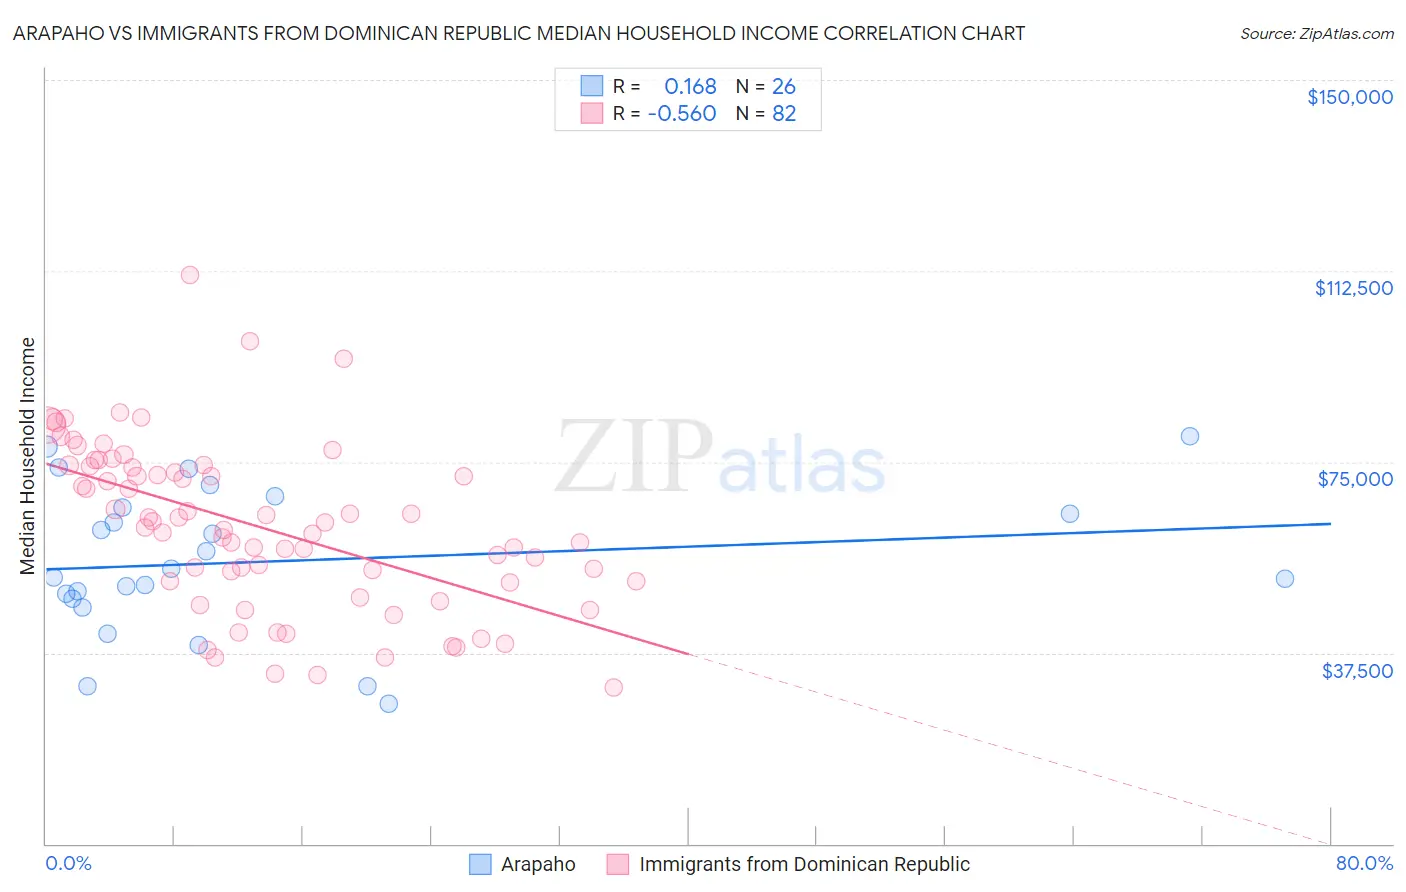
Arapaho vs Immigrants from Dominican Republic Median Household Income Correlation Chart
The statistical analysis conducted on geographies consisting of 29,777,139 people shows a poor positive correlation between the proportion of Arapaho and median household income in the United States with a correlation coefficient (R) of 0.168 and weighted average of $67,965. Similarly, the statistical analysis conducted on geographies consisting of 274,922,738 people shows a substantial negative correlation between the proportion of Immigrants from Dominican Republic and median household income in the United States with a correlation coefficient (R) of -0.560 and weighted average of $70,208, a difference of 3.3%.
Median Household Income Correlation Summary
| Measurement | Arapaho | Immigrants from Dominican Republic |
| Minimum | $27,500 | $30,696 |
| Maximum | $80,000 | $111,701 |
| Range | $52,500 | $81,005 |
| Mean | $55,430 | $62,334 |
| Median | $53,182 | $62,616 |
| Interquartile 25% (IQ1) | $47,998 | $51,486 |
| Interquartile 75% (IQ3) | $66,111 | $74,129 |
| Interquartile Range (IQR) | $18,113 | $22,642 |
| Standard Deviation (Sample) | $14,479 | $16,292 |
| Standard Deviation (Population) | $14,198 | $16,192 |
Demographics Similar to Arapaho and Immigrants from Dominican Republic by Median Household Income
In terms of median household income, the demographic groups most similar to Arapaho are Native/Alaskan ($67,879, a difference of 0.13%), Sioux ($67,792, a difference of 0.25%), Creek ($67,715, a difference of 0.37%), Black/African American ($67,573, a difference of 0.58%), and Dutch West Indian ($68,412, a difference of 0.66%). Similarly, the demographic groups most similar to Immigrants from Dominican Republic are Colville ($70,094, a difference of 0.16%), Chickasaw ($70,005, a difference of 0.29%), Choctaw ($69,947, a difference of 0.37%), Chippewa ($70,539, a difference of 0.47%), and Cajun ($70,605, a difference of 0.56%).
| Demographics | Rating | Rank | Median Household Income |
| Dominicans | 0.0 /100 | #314 | Tragic $71,302 |
| Ottawa | 0.0 /100 | #315 | Tragic $70,984 |
| Apache | 0.0 /100 | #316 | Tragic $70,927 |
| Cajuns | 0.0 /100 | #317 | Tragic $70,605 |
| Chippewa | 0.0 /100 | #318 | Tragic $70,539 |
| Immigrants | Dominican Republic | 0.0 /100 | #319 | Tragic $70,208 |
| Colville | 0.0 /100 | #320 | Tragic $70,094 |
| Chickasaw | 0.0 /100 | #321 | Tragic $70,005 |
| Choctaw | 0.0 /100 | #322 | Tragic $69,947 |
| Bahamians | 0.0 /100 | #323 | Tragic $69,726 |
| Yup'ik | 0.0 /100 | #324 | Tragic $69,695 |
| Seminole | 0.0 /100 | #325 | Tragic $69,420 |
| Yuman | 0.0 /100 | #326 | Tragic $68,743 |
| Immigrants | Cuba | 0.0 /100 | #327 | Tragic $68,461 |
| Menominee | 0.0 /100 | #328 | Tragic $68,423 |
| Dutch West Indians | 0.0 /100 | #329 | Tragic $68,412 |
| Arapaho | 0.0 /100 | #330 | Tragic $67,965 |
| Natives/Alaskans | 0.0 /100 | #331 | Tragic $67,879 |
| Sioux | 0.0 /100 | #332 | Tragic $67,792 |
| Creek | 0.0 /100 | #333 | Tragic $67,715 |
| Blacks/African Americans | 0.0 /100 | #334 | Tragic $67,573 |