English vs Immigrants from Dominican Republic Median Household Income
COMPARE
English
Immigrants from Dominican Republic
Median Household Income
Median Household Income Comparison
English
Immigrants from Dominican Republic
$84,915
MEDIAN HOUSEHOLD INCOME
47.0/ 100
METRIC RATING
179th/ 347
METRIC RANK
$70,208
MEDIAN HOUSEHOLD INCOME
0.0/ 100
METRIC RATING
319th/ 347
METRIC RANK
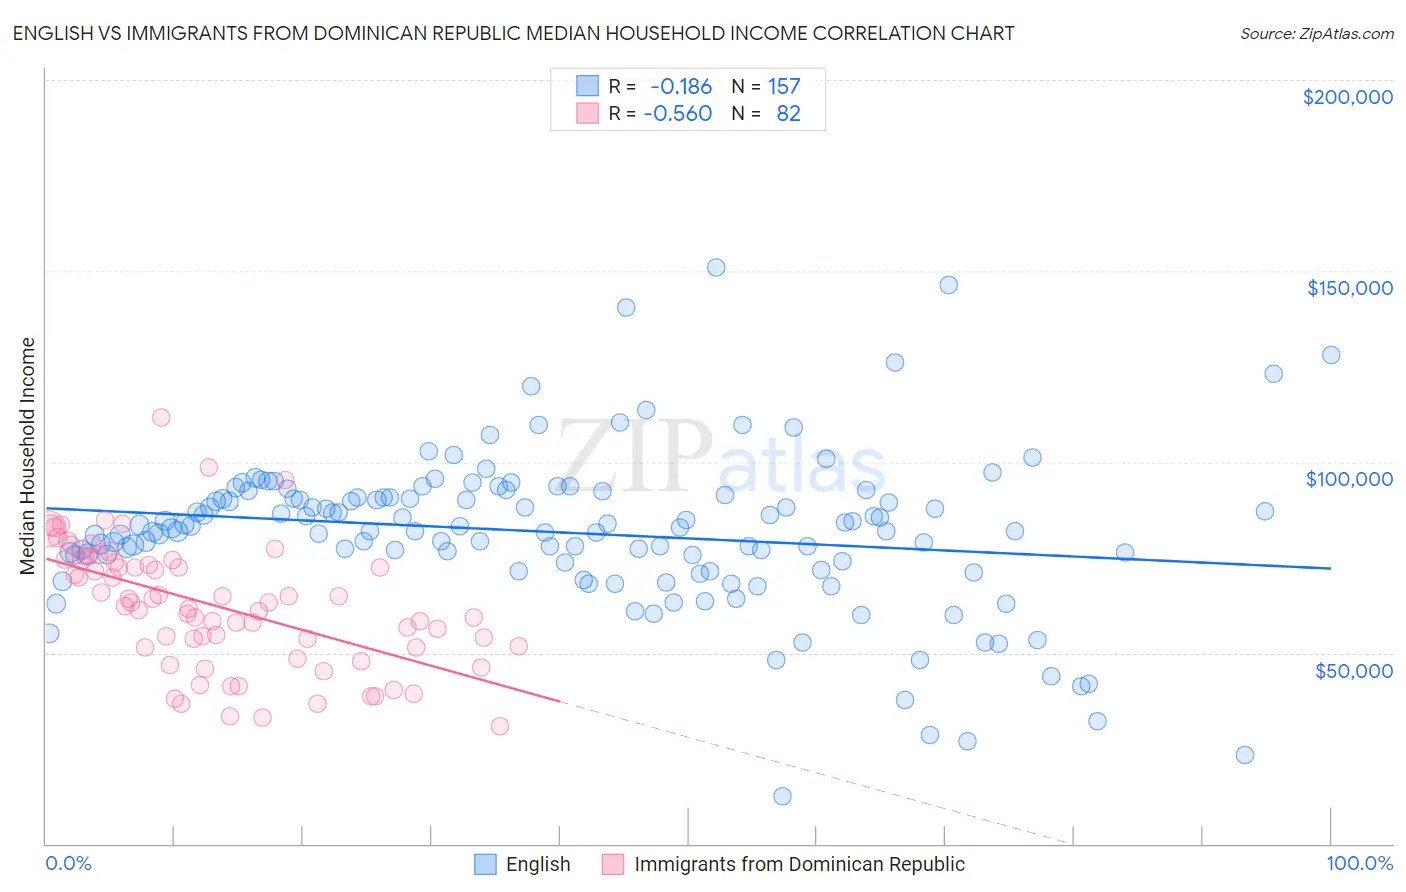
English vs Immigrants from Dominican Republic Median Household Income Correlation Chart
The statistical analysis conducted on geographies consisting of 578,383,901 people shows a poor negative correlation between the proportion of English and median household income in the United States with a correlation coefficient (R) of -0.186 and weighted average of $84,915. Similarly, the statistical analysis conducted on geographies consisting of 274,922,738 people shows a substantial negative correlation between the proportion of Immigrants from Dominican Republic and median household income in the United States with a correlation coefficient (R) of -0.560 and weighted average of $70,208, a difference of 20.9%.
Median Household Income Correlation Summary
| Measurement | English | Immigrants from Dominican Republic |
| Minimum | $12,326 | $30,696 |
| Maximum | $150,805 | $111,701 |
| Range | $138,479 | $81,005 |
| Mean | $81,510 | $62,334 |
| Median | $82,609 | $62,616 |
| Interquartile 25% (IQ1) | $73,869 | $51,486 |
| Interquartile 75% (IQ3) | $90,807 | $74,129 |
| Interquartile Range (IQR) | $16,938 | $22,642 |
| Standard Deviation (Sample) | $20,635 | $16,292 |
| Standard Deviation (Population) | $20,569 | $16,192 |
Similar Demographics by Median Household Income
Demographics Similar to English by Median Household Income
In terms of median household income, the demographic groups most similar to English are Czechoslovakian ($84,965, a difference of 0.060%), Immigrants from Eritrea ($85,025, a difference of 0.13%), Immigrants from Costa Rica ($85,054, a difference of 0.16%), Alsatian ($85,053, a difference of 0.16%), and Immigrants from Portugal ($84,740, a difference of 0.21%).
| Demographics | Rating | Rank | Median Household Income |
| Slovenes | 57.4 /100 | #172 | Average $85,562 |
| Immigrants | Cameroon | 53.4 /100 | #173 | Average $85,314 |
| Scottish | 50.0 /100 | #174 | Average $85,101 |
| Immigrants | Costa Rica | 49.2 /100 | #175 | Average $85,054 |
| Alsatians | 49.2 /100 | #176 | Average $85,053 |
| Immigrants | Eritrea | 48.8 /100 | #177 | Average $85,025 |
| Czechoslovakians | 47.8 /100 | #178 | Average $84,965 |
| English | 47.0 /100 | #179 | Average $84,915 |
| Immigrants | Portugal | 44.2 /100 | #180 | Average $84,740 |
| Hawaiians | 44.1 /100 | #181 | Average $84,729 |
| Uruguayans | 43.5 /100 | #182 | Average $84,691 |
| Spaniards | 42.7 /100 | #183 | Average $84,644 |
| Immigrants | Eastern Africa | 37.4 /100 | #184 | Fair $84,299 |
| Kenyans | 34.2 /100 | #185 | Fair $84,085 |
| Puget Sound Salish | 33.2 /100 | #186 | Fair $84,011 |
Demographics Similar to Immigrants from Dominican Republic by Median Household Income
In terms of median household income, the demographic groups most similar to Immigrants from Dominican Republic are Colville ($70,094, a difference of 0.16%), Chickasaw ($70,005, a difference of 0.29%), Choctaw ($69,947, a difference of 0.37%), Chippewa ($70,539, a difference of 0.47%), and Cajun ($70,605, a difference of 0.56%).
| Demographics | Rating | Rank | Median Household Income |
| Immigrants | Honduras | 0.0 /100 | #312 | Tragic $71,452 |
| Immigrants | Bahamas | 0.0 /100 | #313 | Tragic $71,349 |
| Dominicans | 0.0 /100 | #314 | Tragic $71,302 |
| Ottawa | 0.0 /100 | #315 | Tragic $70,984 |
| Apache | 0.0 /100 | #316 | Tragic $70,927 |
| Cajuns | 0.0 /100 | #317 | Tragic $70,605 |
| Chippewa | 0.0 /100 | #318 | Tragic $70,539 |
| Immigrants | Dominican Republic | 0.0 /100 | #319 | Tragic $70,208 |
| Colville | 0.0 /100 | #320 | Tragic $70,094 |
| Chickasaw | 0.0 /100 | #321 | Tragic $70,005 |
| Choctaw | 0.0 /100 | #322 | Tragic $69,947 |
| Bahamians | 0.0 /100 | #323 | Tragic $69,726 |
| Yup'ik | 0.0 /100 | #324 | Tragic $69,695 |
| Seminole | 0.0 /100 | #325 | Tragic $69,420 |
| Yuman | 0.0 /100 | #326 | Tragic $68,743 |