Immigrants from Western Europe vs Burmese Median Household Income
COMPARE
Immigrants from Western Europe
Burmese
Median Household Income
Median Household Income Comparison
Immigrants from Western Europe
Burmese
$91,936
MEDIAN HOUSEHOLD INCOME
98.8/ 100
METRIC RATING
92nd/ 347
METRIC RANK
$103,145
MEDIAN HOUSEHOLD INCOME
100.0/ 100
METRIC RATING
16th/ 347
METRIC RANK
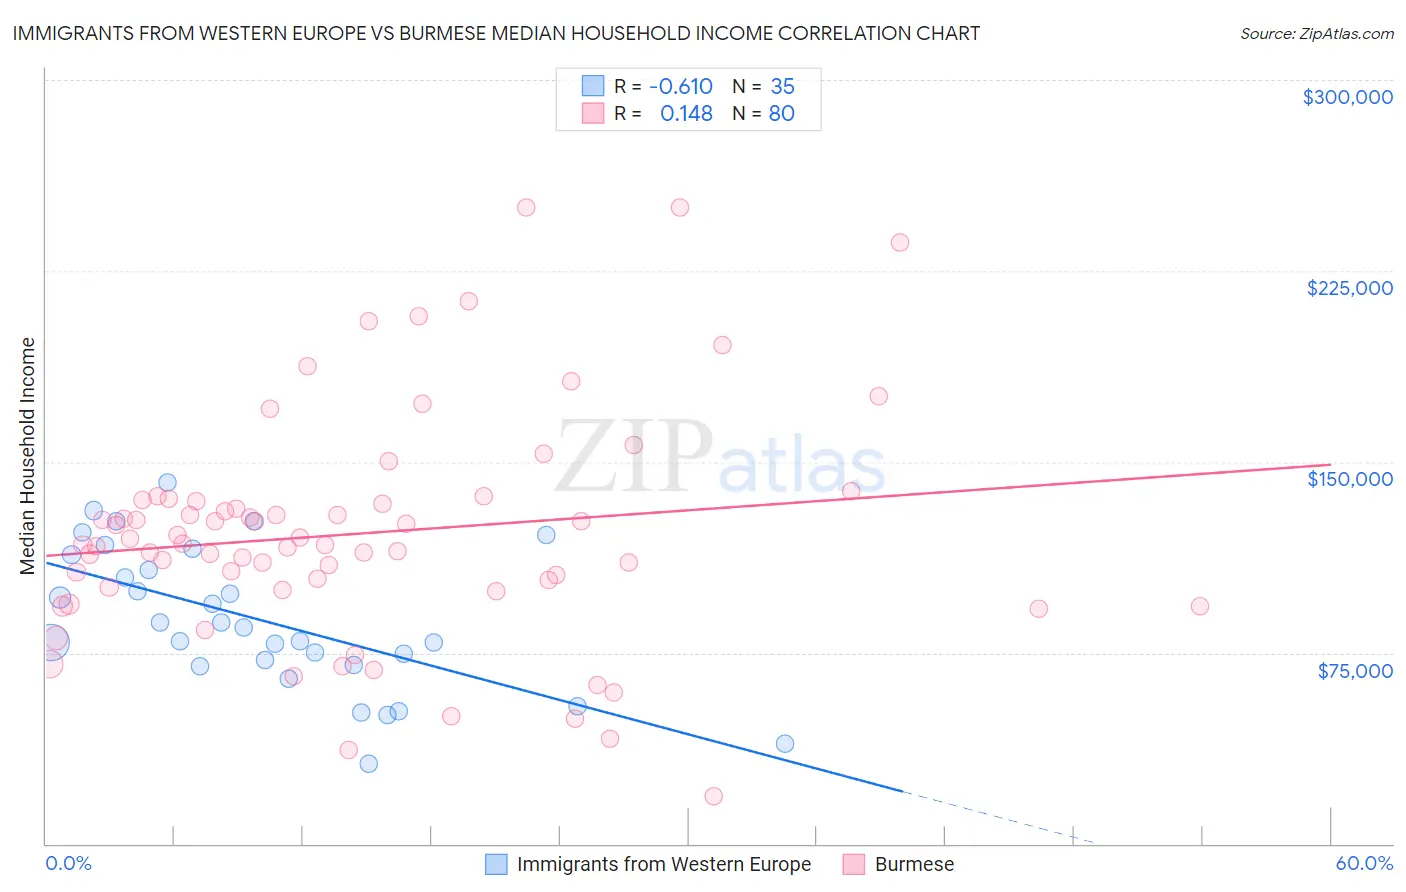
Immigrants from Western Europe vs Burmese Median Household Income Correlation Chart
The statistical analysis conducted on geographies consisting of 493,674,241 people shows a significant negative correlation between the proportion of Immigrants from Western Europe and median household income in the United States with a correlation coefficient (R) of -0.610 and weighted average of $91,936. Similarly, the statistical analysis conducted on geographies consisting of 464,741,598 people shows a poor positive correlation between the proportion of Burmese and median household income in the United States with a correlation coefficient (R) of 0.148 and weighted average of $103,145, a difference of 12.2%.
Median Household Income Correlation Summary
| Measurement | Immigrants from Western Europe | Burmese |
| Minimum | $31,182 | $18,739 |
| Maximum | $142,061 | $250,001 |
| Range | $110,879 | $231,262 |
| Mean | $87,927 | $121,887 |
| Median | $84,863 | $117,660 |
| Interquartile 25% (IQ1) | $69,977 | $100,120 |
| Interquartile 75% (IQ3) | $113,640 | $134,790 |
| Interquartile Range (IQR) | $43,663 | $34,670 |
| Standard Deviation (Sample) | $27,795 | $45,107 |
| Standard Deviation (Population) | $27,395 | $44,824 |
Similar Demographics by Median Household Income
Demographics Similar to Immigrants from Western Europe by Median Household Income
In terms of median household income, the demographic groups most similar to Immigrants from Western Europe are Immigrants from Lebanon ($91,887, a difference of 0.050%), Romanian ($91,994, a difference of 0.060%), Assyrian/Chaldean/Syriac ($91,991, a difference of 0.060%), Immigrants from Vietnam ($91,987, a difference of 0.060%), and Immigrants from North America ($91,860, a difference of 0.080%).
| Demographics | Rating | Rank | Median Household Income |
| Immigrants | Croatia | 99.0 /100 | #85 | Exceptional $92,225 |
| Immigrants | England | 98.9 /100 | #86 | Exceptional $92,098 |
| Immigrants | Hungary | 98.9 /100 | #87 | Exceptional $92,094 |
| Immigrants | Canada | 98.8 /100 | #88 | Exceptional $92,029 |
| Romanians | 98.8 /100 | #89 | Exceptional $91,994 |
| Assyrians/Chaldeans/Syriacs | 98.8 /100 | #90 | Exceptional $91,991 |
| Immigrants | Vietnam | 98.8 /100 | #91 | Exceptional $91,987 |
| Immigrants | Western Europe | 98.8 /100 | #92 | Exceptional $91,936 |
| Immigrants | Lebanon | 98.7 /100 | #93 | Exceptional $91,887 |
| Immigrants | North America | 98.7 /100 | #94 | Exceptional $91,860 |
| Armenians | 98.7 /100 | #95 | Exceptional $91,807 |
| Jordanians | 98.7 /100 | #96 | Exceptional $91,794 |
| Immigrants | Serbia | 98.6 /100 | #97 | Exceptional $91,730 |
| Immigrants | Southern Europe | 98.5 /100 | #98 | Exceptional $91,605 |
| Immigrants | South Eastern Asia | 98.4 /100 | #99 | Exceptional $91,541 |
Demographics Similar to Burmese by Median Household Income
In terms of median household income, the demographic groups most similar to Burmese are Immigrants from Korea ($102,962, a difference of 0.18%), Cypriot ($102,843, a difference of 0.29%), Immigrants from Australia ($102,562, a difference of 0.57%), Immigrants from Israel ($104,090, a difference of 0.92%), and Bolivian ($102,195, a difference of 0.93%).
| Demographics | Rating | Rank | Median Household Income |
| Okinawans | 100.0 /100 | #9 | Exceptional $106,624 |
| Immigrants | South Central Asia | 100.0 /100 | #10 | Exceptional $106,057 |
| Immigrants | China | 100.0 /100 | #11 | Exceptional $105,335 |
| Indians (Asian) | 100.0 /100 | #12 | Exceptional $105,262 |
| Immigrants | Eastern Asia | 100.0 /100 | #13 | Exceptional $104,796 |
| Immigrants | Ireland | 100.0 /100 | #14 | Exceptional $104,692 |
| Immigrants | Israel | 100.0 /100 | #15 | Exceptional $104,090 |
| Burmese | 100.0 /100 | #16 | Exceptional $103,145 |
| Immigrants | Korea | 100.0 /100 | #17 | Exceptional $102,962 |
| Cypriots | 100.0 /100 | #18 | Exceptional $102,843 |
| Immigrants | Australia | 100.0 /100 | #19 | Exceptional $102,562 |
| Bolivians | 100.0 /100 | #20 | Exceptional $102,195 |
| Eastern Europeans | 100.0 /100 | #21 | Exceptional $101,781 |
| Asians | 100.0 /100 | #22 | Exceptional $101,681 |
| Immigrants | Bolivia | 100.0 /100 | #23 | Exceptional $101,394 |