Immigrants from Denmark vs Burmese Median Household Income
COMPARE
Immigrants from Denmark
Burmese
Median Household Income
Median Household Income Comparison
Immigrants from Denmark
Burmese
$98,510
MEDIAN HOUSEHOLD INCOME
100.0/ 100
METRIC RATING
32nd/ 347
METRIC RANK
$103,145
MEDIAN HOUSEHOLD INCOME
100.0/ 100
METRIC RATING
16th/ 347
METRIC RANK
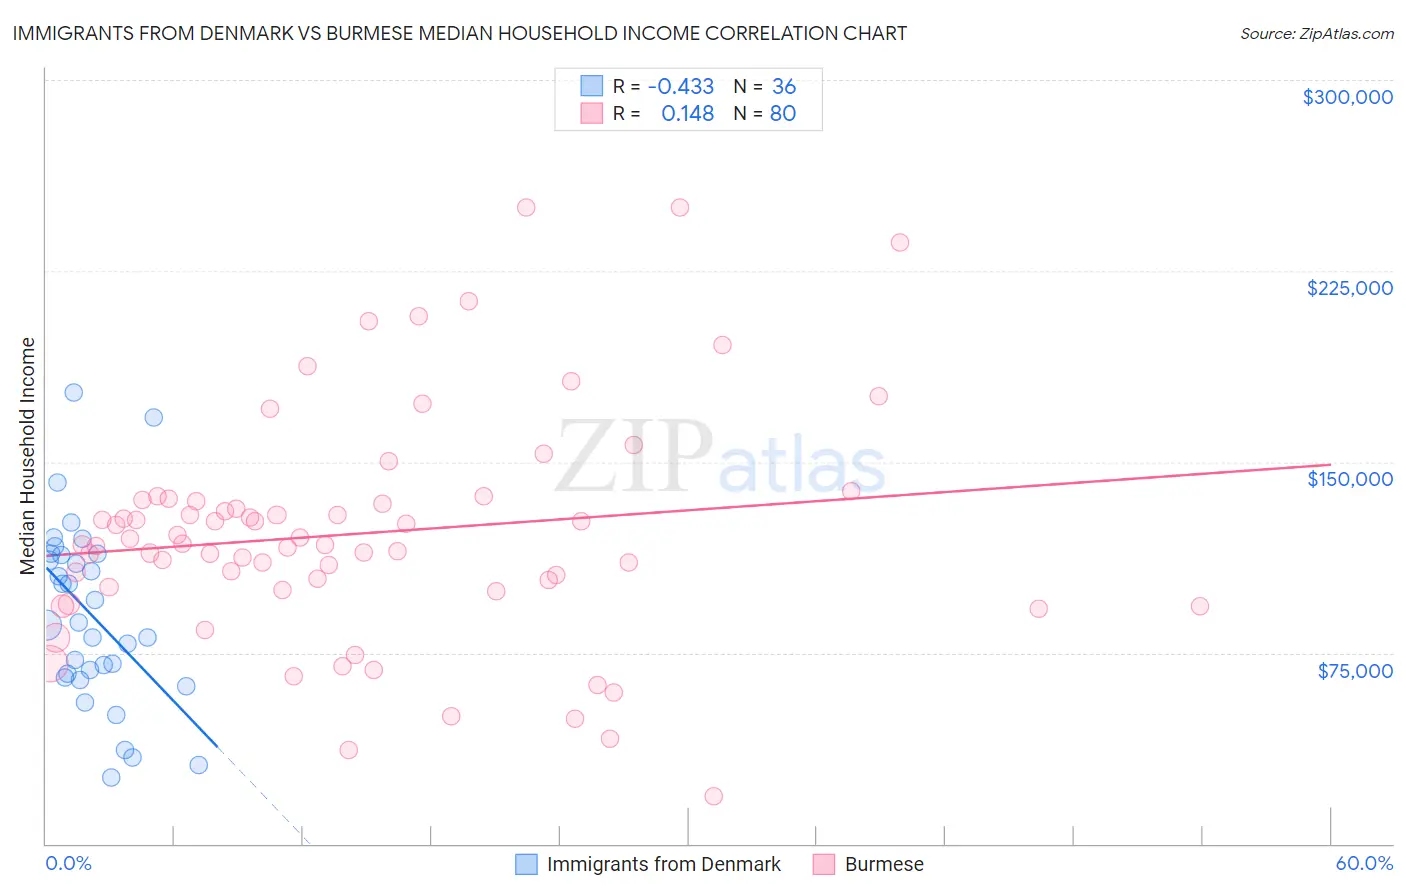
Immigrants from Denmark vs Burmese Median Household Income Correlation Chart
The statistical analysis conducted on geographies consisting of 136,400,553 people shows a moderate negative correlation between the proportion of Immigrants from Denmark and median household income in the United States with a correlation coefficient (R) of -0.433 and weighted average of $98,510. Similarly, the statistical analysis conducted on geographies consisting of 464,741,598 people shows a poor positive correlation between the proportion of Burmese and median household income in the United States with a correlation coefficient (R) of 0.148 and weighted average of $103,145, a difference of 4.7%.
Median Household Income Correlation Summary
| Measurement | Immigrants from Denmark | Burmese |
| Minimum | $26,000 | $18,739 |
| Maximum | $177,030 | $250,001 |
| Range | $151,030 | $231,262 |
| Mean | $89,771 | $121,887 |
| Median | $86,345 | $117,660 |
| Interquartile 25% (IQ1) | $66,126 | $100,120 |
| Interquartile 75% (IQ3) | $113,584 | $134,790 |
| Interquartile Range (IQR) | $47,458 | $34,670 |
| Standard Deviation (Sample) | $35,565 | $45,107 |
| Standard Deviation (Population) | $35,068 | $44,824 |
Demographics Similar to Immigrants from Denmark and Burmese by Median Household Income
In terms of median household income, the demographic groups most similar to Immigrants from Denmark are Chinese ($98,496, a difference of 0.010%), Russian ($98,008, a difference of 0.51%), Turkish ($99,389, a difference of 0.89%), Immigrants from Northern Europe ($99,813, a difference of 1.3%), and Immigrants from Asia ($99,933, a difference of 1.4%). Similarly, the demographic groups most similar to Burmese are Immigrants from Korea ($102,962, a difference of 0.18%), Cypriot ($102,843, a difference of 0.29%), Immigrants from Australia ($102,562, a difference of 0.57%), Immigrants from Israel ($104,090, a difference of 0.92%), and Bolivian ($102,195, a difference of 0.93%).
| Demographics | Rating | Rank | Median Household Income |
| Immigrants | Ireland | 100.0 /100 | #14 | Exceptional $104,692 |
| Immigrants | Israel | 100.0 /100 | #15 | Exceptional $104,090 |
| Burmese | 100.0 /100 | #16 | Exceptional $103,145 |
| Immigrants | Korea | 100.0 /100 | #17 | Exceptional $102,962 |
| Cypriots | 100.0 /100 | #18 | Exceptional $102,843 |
| Immigrants | Australia | 100.0 /100 | #19 | Exceptional $102,562 |
| Bolivians | 100.0 /100 | #20 | Exceptional $102,195 |
| Eastern Europeans | 100.0 /100 | #21 | Exceptional $101,781 |
| Asians | 100.0 /100 | #22 | Exceptional $101,681 |
| Immigrants | Bolivia | 100.0 /100 | #23 | Exceptional $101,394 |
| Immigrants | Japan | 100.0 /100 | #24 | Exceptional $100,711 |
| Immigrants | Sweden | 100.0 /100 | #25 | Exceptional $100,699 |
| Immigrants | Belgium | 100.0 /100 | #26 | Exceptional $100,306 |
| Bhutanese | 100.0 /100 | #27 | Exceptional $100,151 |
| Immigrants | Sri Lanka | 100.0 /100 | #28 | Exceptional $99,943 |
| Immigrants | Asia | 100.0 /100 | #29 | Exceptional $99,933 |
| Immigrants | Northern Europe | 100.0 /100 | #30 | Exceptional $99,813 |
| Turks | 100.0 /100 | #31 | Exceptional $99,389 |
| Immigrants | Denmark | 100.0 /100 | #32 | Exceptional $98,510 |
| Chinese | 100.0 /100 | #33 | Exceptional $98,496 |
| Russians | 100.0 /100 | #34 | Exceptional $98,008 |