Danish vs Burmese Median Household Income
COMPARE
Danish
Burmese
Median Household Income
Median Household Income Comparison
Danes
Burmese
$87,676
MEDIAN HOUSEHOLD INCOME
83.9/ 100
METRIC RATING
143rd/ 347
METRIC RANK
$103,145
MEDIAN HOUSEHOLD INCOME
100.0/ 100
METRIC RATING
16th/ 347
METRIC RANK
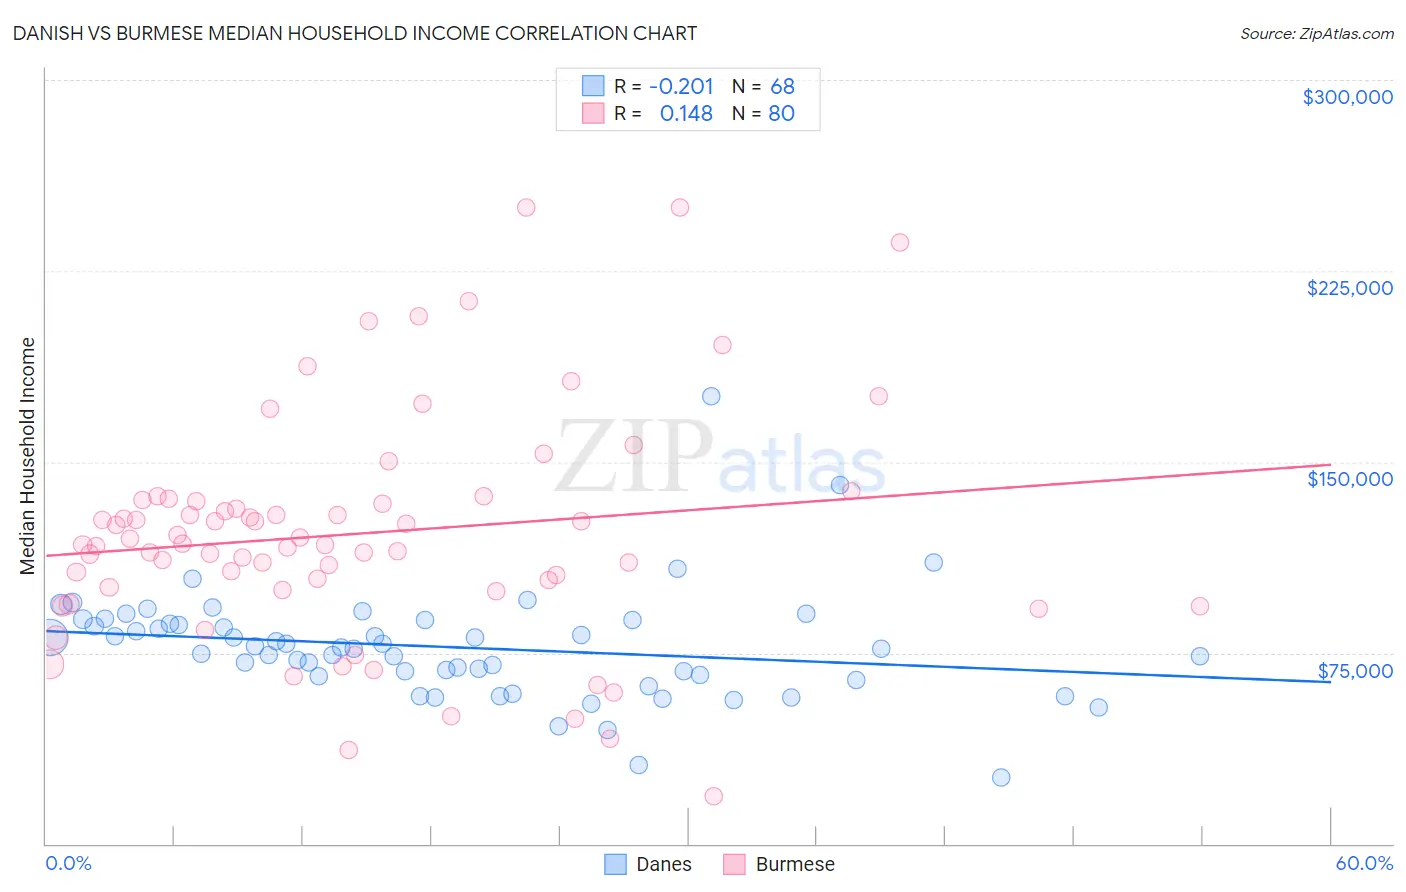
Danish vs Burmese Median Household Income Correlation Chart
The statistical analysis conducted on geographies consisting of 473,742,440 people shows a weak negative correlation between the proportion of Danes and median household income in the United States with a correlation coefficient (R) of -0.201 and weighted average of $87,676. Similarly, the statistical analysis conducted on geographies consisting of 464,741,598 people shows a poor positive correlation between the proportion of Burmese and median household income in the United States with a correlation coefficient (R) of 0.148 and weighted average of $103,145, a difference of 17.6%.
Median Household Income Correlation Summary
| Measurement | Danish | Burmese |
| Minimum | $25,809 | $18,739 |
| Maximum | $175,595 | $250,001 |
| Range | $149,786 | $231,262 |
| Mean | $77,182 | $121,887 |
| Median | $76,890 | $117,660 |
| Interquartile 25% (IQ1) | $66,124 | $100,120 |
| Interquartile 75% (IQ3) | $87,030 | $134,790 |
| Interquartile Range (IQR) | $20,907 | $34,670 |
| Standard Deviation (Sample) | $21,727 | $45,107 |
| Standard Deviation (Population) | $21,566 | $44,824 |
Similar Demographics by Median Household Income
Demographics Similar to Danes by Median Household Income
In terms of median household income, the demographic groups most similar to Danes are Canadian ($87,769, a difference of 0.11%), Serbian ($87,572, a difference of 0.12%), Ugandan ($87,557, a difference of 0.14%), Immigrants from Uganda ($87,553, a difference of 0.14%), and South American Indian ($87,446, a difference of 0.26%).
| Demographics | Rating | Rank | Median Household Income |
| Poles | 89.7 /100 | #136 | Excellent $88,472 |
| Sierra Leoneans | 89.6 /100 | #137 | Excellent $88,463 |
| Arabs | 89.2 /100 | #138 | Excellent $88,398 |
| Immigrants | Chile | 89.2 /100 | #139 | Excellent $88,388 |
| Lebanese | 87.2 /100 | #140 | Excellent $88,091 |
| Immigrants | Morocco | 86.0 /100 | #141 | Excellent $87,930 |
| Canadians | 84.7 /100 | #142 | Excellent $87,769 |
| Danes | 83.9 /100 | #143 | Excellent $87,676 |
| Serbians | 83.0 /100 | #144 | Excellent $87,572 |
| Ugandans | 82.9 /100 | #145 | Excellent $87,557 |
| Immigrants | Uganda | 82.8 /100 | #146 | Excellent $87,553 |
| South American Indians | 81.8 /100 | #147 | Excellent $87,446 |
| Costa Ricans | 80.0 /100 | #148 | Excellent $87,262 |
| Immigrants | Nepal | 77.7 /100 | #149 | Good $87,046 |
| Basques | 77.2 /100 | #150 | Good $87,001 |
Demographics Similar to Burmese by Median Household Income
In terms of median household income, the demographic groups most similar to Burmese are Immigrants from Korea ($102,962, a difference of 0.18%), Cypriot ($102,843, a difference of 0.29%), Immigrants from Australia ($102,562, a difference of 0.57%), Immigrants from Israel ($104,090, a difference of 0.92%), and Bolivian ($102,195, a difference of 0.93%).
| Demographics | Rating | Rank | Median Household Income |
| Okinawans | 100.0 /100 | #9 | Exceptional $106,624 |
| Immigrants | South Central Asia | 100.0 /100 | #10 | Exceptional $106,057 |
| Immigrants | China | 100.0 /100 | #11 | Exceptional $105,335 |
| Indians (Asian) | 100.0 /100 | #12 | Exceptional $105,262 |
| Immigrants | Eastern Asia | 100.0 /100 | #13 | Exceptional $104,796 |
| Immigrants | Ireland | 100.0 /100 | #14 | Exceptional $104,692 |
| Immigrants | Israel | 100.0 /100 | #15 | Exceptional $104,090 |
| Burmese | 100.0 /100 | #16 | Exceptional $103,145 |
| Immigrants | Korea | 100.0 /100 | #17 | Exceptional $102,962 |
| Cypriots | 100.0 /100 | #18 | Exceptional $102,843 |
| Immigrants | Australia | 100.0 /100 | #19 | Exceptional $102,562 |
| Bolivians | 100.0 /100 | #20 | Exceptional $102,195 |
| Eastern Europeans | 100.0 /100 | #21 | Exceptional $101,781 |
| Asians | 100.0 /100 | #22 | Exceptional $101,681 |
| Immigrants | Bolivia | 100.0 /100 | #23 | Exceptional $101,394 |