Ute vs Immigrants from Burma/Myanmar Householder Income Ages 45 - 64 years
COMPARE
Ute
Immigrants from Burma/Myanmar
Householder Income Ages 45 - 64 years
Householder Income Ages 45 - 64 years Comparison
Ute
Immigrants from Burma/Myanmar
$83,937
HOUSEHOLDER INCOME AGES 45 - 64 YEARS
0.0/ 100
METRIC RATING
306th/ 347
METRIC RANK
$91,385
HOUSEHOLDER INCOME AGES 45 - 64 YEARS
1.1/ 100
METRIC RATING
240th/ 347
METRIC RANK
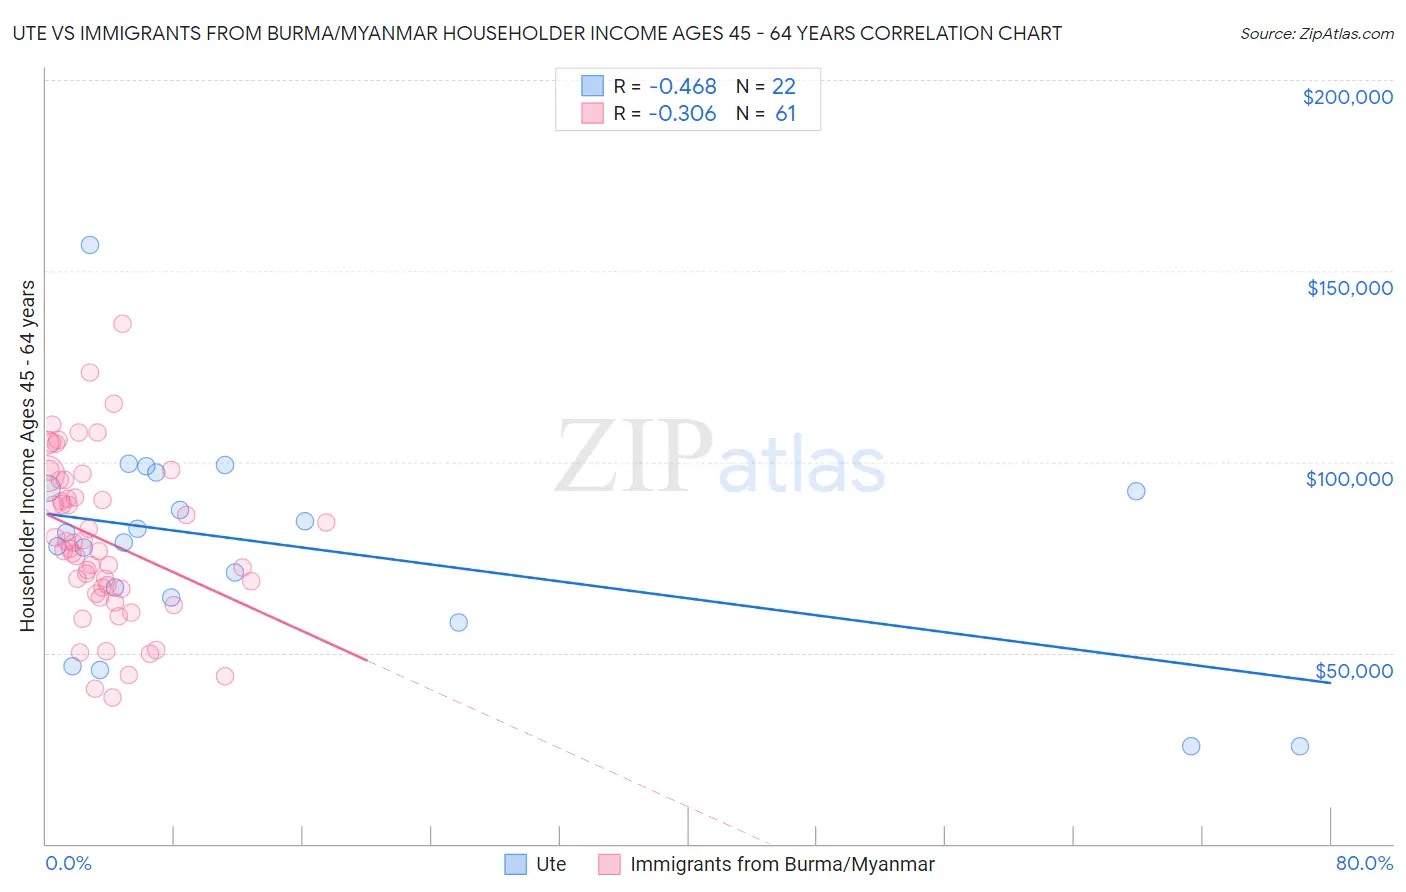
Ute vs Immigrants from Burma/Myanmar Householder Income Ages 45 - 64 years Correlation Chart
The statistical analysis conducted on geographies consisting of 55,640,692 people shows a moderate negative correlation between the proportion of Ute and household income with householder between the ages 45 and 64 in the United States with a correlation coefficient (R) of -0.468 and weighted average of $83,937. Similarly, the statistical analysis conducted on geographies consisting of 172,192,381 people shows a mild negative correlation between the proportion of Immigrants from Burma/Myanmar and household income with householder between the ages 45 and 64 in the United States with a correlation coefficient (R) of -0.306 and weighted average of $91,385, a difference of 8.9%.
Householder Income Ages 45 - 64 years Correlation Summary
| Measurement | Ute | Immigrants from Burma/Myanmar |
| Minimum | $25,694 | $38,314 |
| Maximum | $156,708 | $136,250 |
| Range | $131,014 | $97,936 |
| Mean | $77,764 | $79,553 |
| Median | $80,253 | $77,270 |
| Interquartile 25% (IQ1) | $64,449 | $66,032 |
| Interquartile 75% (IQ3) | $93,045 | $95,170 |
| Interquartile Range (IQR) | $28,595 | $29,138 |
| Standard Deviation (Sample) | $28,260 | $21,018 |
| Standard Deviation (Population) | $27,610 | $20,845 |
Similar Demographics by Householder Income Ages 45 - 64 years
Demographics Similar to Ute by Householder Income Ages 45 - 64 years
In terms of householder income ages 45 - 64 years, the demographic groups most similar to Ute are Chippewa ($83,943, a difference of 0.010%), Ottawa ($83,953, a difference of 0.020%), Honduran ($84,079, a difference of 0.17%), Shoshone ($83,588, a difference of 0.42%), and Immigrants from Cabo Verde ($83,542, a difference of 0.47%).
| Demographics | Rating | Rank | Householder Income Ages 45 - 64 years |
| Immigrants | Mexico | 0.0 /100 | #299 | Tragic $84,910 |
| Indonesians | 0.0 /100 | #300 | Tragic $84,890 |
| Potawatomi | 0.0 /100 | #301 | Tragic $84,613 |
| Haitians | 0.0 /100 | #302 | Tragic $84,384 |
| Hondurans | 0.0 /100 | #303 | Tragic $84,079 |
| Ottawa | 0.0 /100 | #304 | Tragic $83,953 |
| Chippewa | 0.0 /100 | #305 | Tragic $83,943 |
| Ute | 0.0 /100 | #306 | Tragic $83,937 |
| Shoshone | 0.0 /100 | #307 | Tragic $83,588 |
| Immigrants | Cabo Verde | 0.0 /100 | #308 | Tragic $83,542 |
| Immigrants | Dominica | 0.0 /100 | #309 | Tragic $83,311 |
| Immigrants | Haiti | 0.0 /100 | #310 | Tragic $83,257 |
| Immigrants | Bahamas | 0.0 /100 | #311 | Tragic $83,177 |
| Cajuns | 0.0 /100 | #312 | Tragic $83,015 |
| U.S. Virgin Islanders | 0.0 /100 | #313 | Tragic $82,736 |
Demographics Similar to Immigrants from Burma/Myanmar by Householder Income Ages 45 - 64 years
In terms of householder income ages 45 - 64 years, the demographic groups most similar to Immigrants from Burma/Myanmar are Trinidadian and Tobagonian ($91,357, a difference of 0.030%), Inupiat ($91,355, a difference of 0.030%), Immigrants from Trinidad and Tobago ($91,347, a difference of 0.040%), Immigrants from Ecuador ($91,462, a difference of 0.080%), and Immigrants from Middle Africa ($91,293, a difference of 0.10%).
| Demographics | Rating | Rank | Householder Income Ages 45 - 64 years |
| Nepalese | 3.0 /100 | #233 | Tragic $93,355 |
| Immigrants | El Salvador | 2.7 /100 | #234 | Tragic $93,176 |
| Nicaraguans | 2.0 /100 | #235 | Tragic $92,554 |
| Immigrants | Western Africa | 1.8 /100 | #236 | Tragic $92,384 |
| Immigrants | Bangladesh | 1.7 /100 | #237 | Tragic $92,208 |
| Pennsylvania Germans | 1.5 /100 | #238 | Tragic $91,956 |
| Immigrants | Ecuador | 1.2 /100 | #239 | Tragic $91,462 |
| Immigrants | Burma/Myanmar | 1.1 /100 | #240 | Tragic $91,385 |
| Trinidadians and Tobagonians | 1.1 /100 | #241 | Tragic $91,357 |
| Inupiat | 1.1 /100 | #242 | Tragic $91,355 |
| Immigrants | Trinidad and Tobago | 1.1 /100 | #243 | Tragic $91,347 |
| Immigrants | Middle Africa | 1.1 /100 | #244 | Tragic $91,293 |
| Guyanese | 0.9 /100 | #245 | Tragic $90,966 |
| Central Americans | 0.9 /100 | #246 | Tragic $90,951 |
| Alaskan Athabascans | 0.9 /100 | #247 | Tragic $90,951 |