Ute vs Portuguese Householder Income Ages 45 - 64 years
COMPARE
Ute
Portuguese
Householder Income Ages 45 - 64 years
Householder Income Ages 45 - 64 years Comparison
Ute
Portuguese
$83,937
HOUSEHOLDER INCOME AGES 45 - 64 YEARS
0.0/ 100
METRIC RATING
306th/ 347
METRIC RANK
$105,309
HOUSEHOLDER INCOME AGES 45 - 64 YEARS
92.4/ 100
METRIC RATING
126th/ 347
METRIC RANK
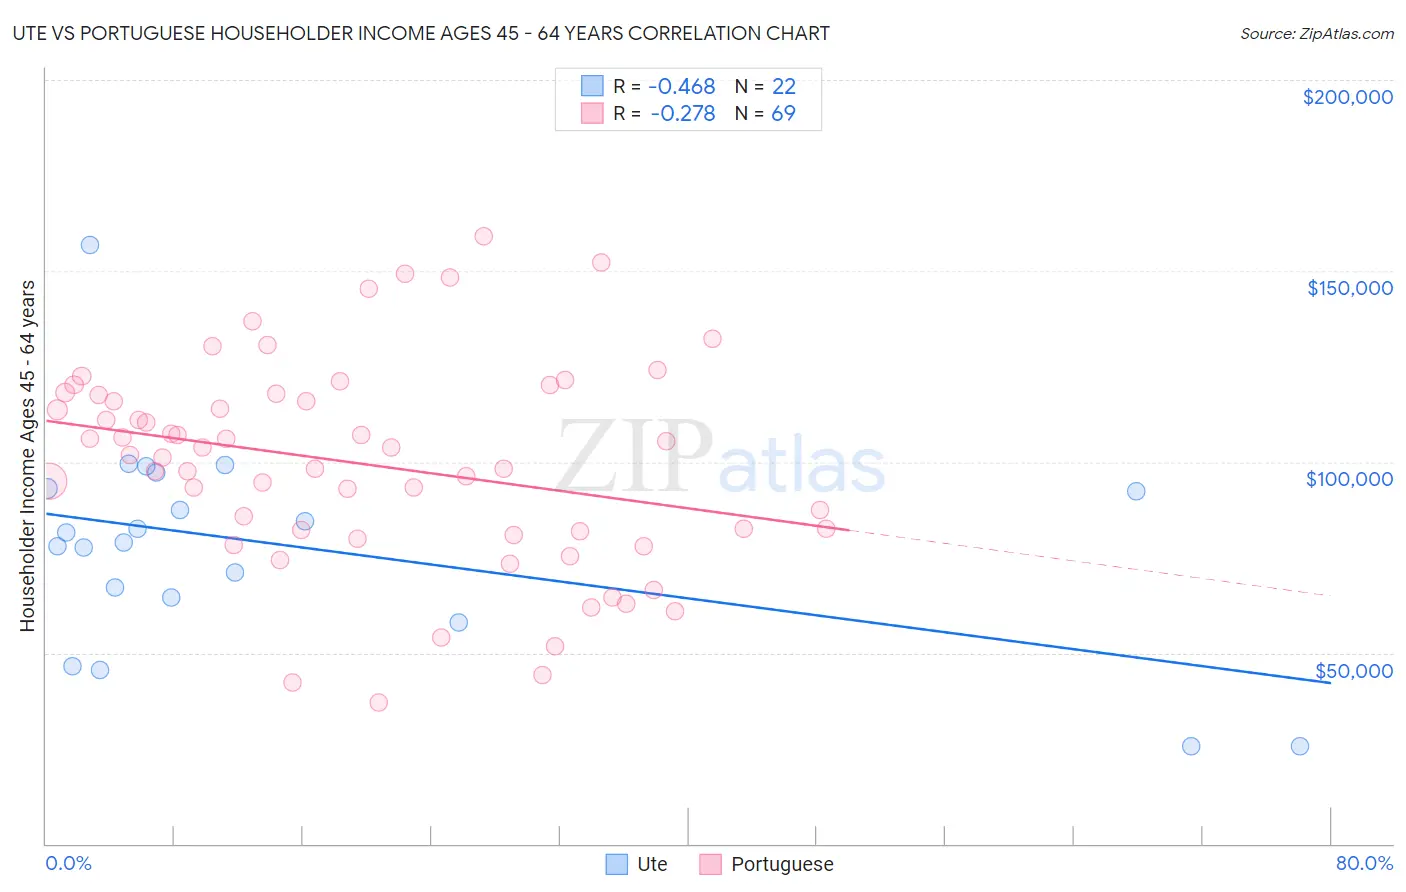
Ute vs Portuguese Householder Income Ages 45 - 64 years Correlation Chart
The statistical analysis conducted on geographies consisting of 55,640,692 people shows a moderate negative correlation between the proportion of Ute and household income with householder between the ages 45 and 64 in the United States with a correlation coefficient (R) of -0.468 and weighted average of $83,937. Similarly, the statistical analysis conducted on geographies consisting of 449,072,520 people shows a weak negative correlation between the proportion of Portuguese and household income with householder between the ages 45 and 64 in the United States with a correlation coefficient (R) of -0.278 and weighted average of $105,309, a difference of 25.5%.
Householder Income Ages 45 - 64 years Correlation Summary
| Measurement | Ute | Portuguese |
| Minimum | $25,694 | $36,861 |
| Maximum | $156,708 | $159,085 |
| Range | $131,014 | $122,224 |
| Mean | $77,764 | $99,397 |
| Median | $80,253 | $101,779 |
| Interquartile 25% (IQ1) | $64,449 | $81,364 |
| Interquartile 75% (IQ3) | $93,045 | $117,677 |
| Interquartile Range (IQR) | $28,595 | $36,312 |
| Standard Deviation (Sample) | $28,260 | $27,067 |
| Standard Deviation (Population) | $27,610 | $26,870 |
Similar Demographics by Householder Income Ages 45 - 64 years
Demographics Similar to Ute by Householder Income Ages 45 - 64 years
In terms of householder income ages 45 - 64 years, the demographic groups most similar to Ute are Chippewa ($83,943, a difference of 0.010%), Ottawa ($83,953, a difference of 0.020%), Honduran ($84,079, a difference of 0.17%), Shoshone ($83,588, a difference of 0.42%), and Immigrants from Cabo Verde ($83,542, a difference of 0.47%).
| Demographics | Rating | Rank | Householder Income Ages 45 - 64 years |
| Immigrants | Mexico | 0.0 /100 | #299 | Tragic $84,910 |
| Indonesians | 0.0 /100 | #300 | Tragic $84,890 |
| Potawatomi | 0.0 /100 | #301 | Tragic $84,613 |
| Haitians | 0.0 /100 | #302 | Tragic $84,384 |
| Hondurans | 0.0 /100 | #303 | Tragic $84,079 |
| Ottawa | 0.0 /100 | #304 | Tragic $83,953 |
| Chippewa | 0.0 /100 | #305 | Tragic $83,943 |
| Ute | 0.0 /100 | #306 | Tragic $83,937 |
| Shoshone | 0.0 /100 | #307 | Tragic $83,588 |
| Immigrants | Cabo Verde | 0.0 /100 | #308 | Tragic $83,542 |
| Immigrants | Dominica | 0.0 /100 | #309 | Tragic $83,311 |
| Immigrants | Haiti | 0.0 /100 | #310 | Tragic $83,257 |
| Immigrants | Bahamas | 0.0 /100 | #311 | Tragic $83,177 |
| Cajuns | 0.0 /100 | #312 | Tragic $83,015 |
| U.S. Virgin Islanders | 0.0 /100 | #313 | Tragic $82,736 |
Demographics Similar to Portuguese by Householder Income Ages 45 - 64 years
In terms of householder income ages 45 - 64 years, the demographic groups most similar to Portuguese are Pakistani ($105,317, a difference of 0.010%), Immigrants from Saudi Arabia ($105,249, a difference of 0.060%), Immigrants from Northern Africa ($105,430, a difference of 0.12%), Native Hawaiian ($105,149, a difference of 0.15%), and Peruvian ($105,070, a difference of 0.23%).
| Demographics | Rating | Rank | Householder Income Ages 45 - 64 years |
| Immigrants | Jordan | 94.9 /100 | #119 | Exceptional $106,164 |
| Immigrants | South Eastern Asia | 94.8 /100 | #120 | Exceptional $106,109 |
| Poles | 94.4 /100 | #121 | Exceptional $105,952 |
| Immigrants | North Macedonia | 94.2 /100 | #122 | Exceptional $105,892 |
| Danes | 93.4 /100 | #123 | Exceptional $105,619 |
| Immigrants | Northern Africa | 92.8 /100 | #124 | Exceptional $105,430 |
| Pakistanis | 92.4 /100 | #125 | Exceptional $105,317 |
| Portuguese | 92.4 /100 | #126 | Exceptional $105,309 |
| Immigrants | Saudi Arabia | 92.2 /100 | #127 | Exceptional $105,249 |
| Native Hawaiians | 91.8 /100 | #128 | Exceptional $105,149 |
| Peruvians | 91.5 /100 | #129 | Exceptional $105,070 |
| Immigrants | Zimbabwe | 91.2 /100 | #130 | Exceptional $104,992 |
| Immigrants | Syria | 90.7 /100 | #131 | Exceptional $104,858 |
| Lebanese | 90.1 /100 | #132 | Exceptional $104,734 |
| Arabs | 89.3 /100 | #133 | Excellent $104,566 |