Ute vs Chinese Householder Income Ages 45 - 64 years
COMPARE
Ute
Chinese
Householder Income Ages 45 - 64 years
Householder Income Ages 45 - 64 years Comparison
Ute
Chinese
$83,937
HOUSEHOLDER INCOME AGES 45 - 64 YEARS
0.0/ 100
METRIC RATING
306th/ 347
METRIC RANK
$116,156
HOUSEHOLDER INCOME AGES 45 - 64 YEARS
100.0/ 100
METRIC RATING
33rd/ 347
METRIC RANK
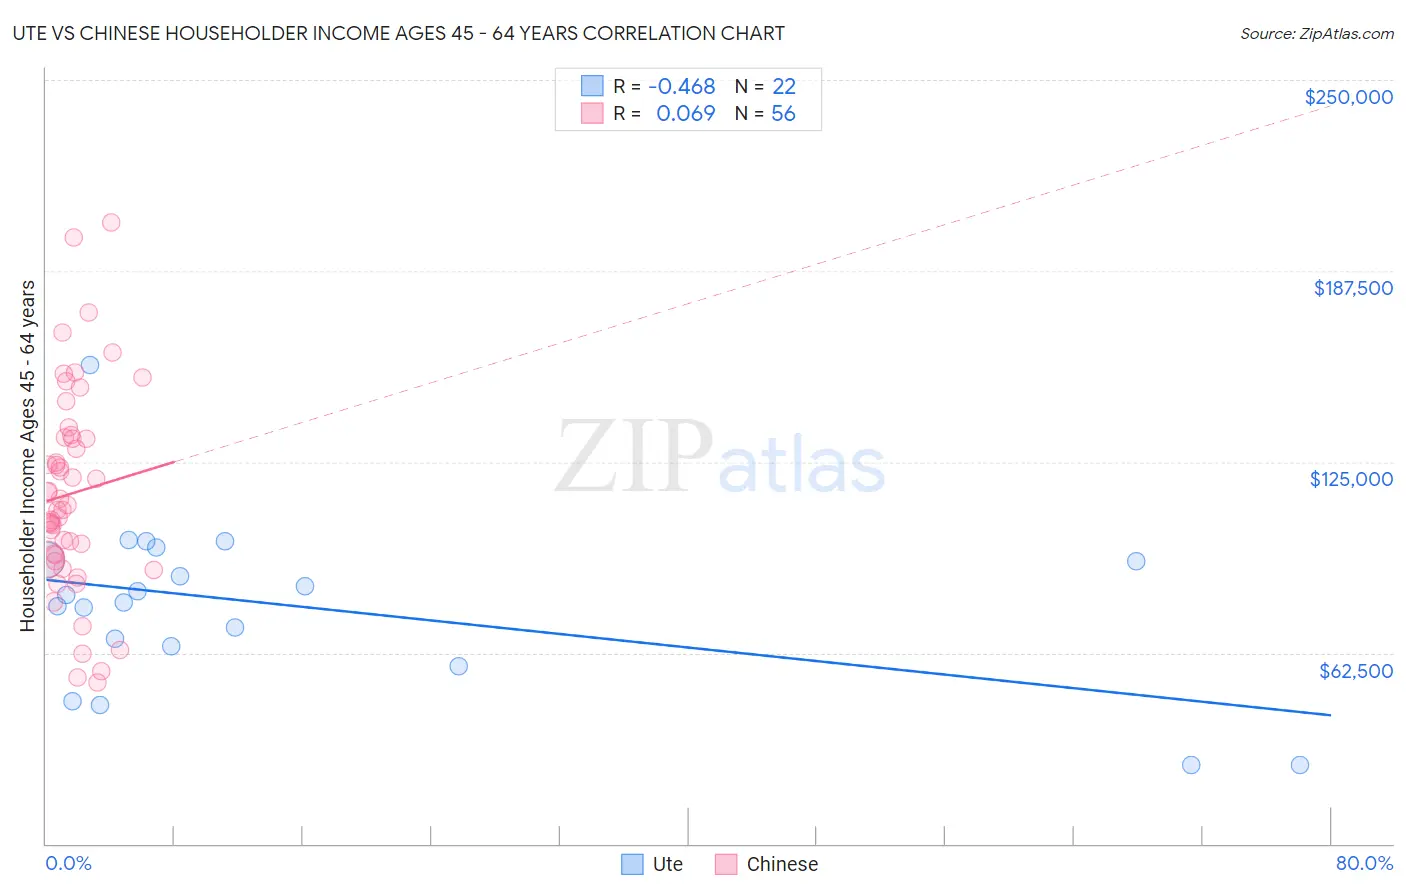
Ute vs Chinese Householder Income Ages 45 - 64 years Correlation Chart
The statistical analysis conducted on geographies consisting of 55,640,692 people shows a moderate negative correlation between the proportion of Ute and household income with householder between the ages 45 and 64 in the United States with a correlation coefficient (R) of -0.468 and weighted average of $83,937. Similarly, the statistical analysis conducted on geographies consisting of 64,773,263 people shows a slight positive correlation between the proportion of Chinese and household income with householder between the ages 45 and 64 in the United States with a correlation coefficient (R) of 0.069 and weighted average of $116,156, a difference of 38.4%.
Householder Income Ages 45 - 64 years Correlation Summary
| Measurement | Ute | Chinese |
| Minimum | $25,694 | $52,969 |
| Maximum | $156,708 | $203,211 |
| Range | $131,014 | $150,242 |
| Mean | $77,764 | $114,652 |
| Median | $80,253 | $110,020 |
| Interquartile 25% (IQ1) | $64,449 | $93,748 |
| Interquartile 75% (IQ3) | $93,045 | $132,670 |
| Interquartile Range (IQR) | $28,595 | $38,922 |
| Standard Deviation (Sample) | $28,260 | $33,042 |
| Standard Deviation (Population) | $27,610 | $32,746 |
Similar Demographics by Householder Income Ages 45 - 64 years
Demographics Similar to Ute by Householder Income Ages 45 - 64 years
In terms of householder income ages 45 - 64 years, the demographic groups most similar to Ute are Chippewa ($83,943, a difference of 0.010%), Ottawa ($83,953, a difference of 0.020%), Honduran ($84,079, a difference of 0.17%), Shoshone ($83,588, a difference of 0.42%), and Immigrants from Cabo Verde ($83,542, a difference of 0.47%).
| Demographics | Rating | Rank | Householder Income Ages 45 - 64 years |
| Immigrants | Mexico | 0.0 /100 | #299 | Tragic $84,910 |
| Indonesians | 0.0 /100 | #300 | Tragic $84,890 |
| Potawatomi | 0.0 /100 | #301 | Tragic $84,613 |
| Haitians | 0.0 /100 | #302 | Tragic $84,384 |
| Hondurans | 0.0 /100 | #303 | Tragic $84,079 |
| Ottawa | 0.0 /100 | #304 | Tragic $83,953 |
| Chippewa | 0.0 /100 | #305 | Tragic $83,943 |
| Ute | 0.0 /100 | #306 | Tragic $83,937 |
| Shoshone | 0.0 /100 | #307 | Tragic $83,588 |
| Immigrants | Cabo Verde | 0.0 /100 | #308 | Tragic $83,542 |
| Immigrants | Dominica | 0.0 /100 | #309 | Tragic $83,311 |
| Immigrants | Haiti | 0.0 /100 | #310 | Tragic $83,257 |
| Immigrants | Bahamas | 0.0 /100 | #311 | Tragic $83,177 |
| Cajuns | 0.0 /100 | #312 | Tragic $83,015 |
| U.S. Virgin Islanders | 0.0 /100 | #313 | Tragic $82,736 |
Demographics Similar to Chinese by Householder Income Ages 45 - 64 years
In terms of householder income ages 45 - 64 years, the demographic groups most similar to Chinese are Immigrants from Denmark ($116,000, a difference of 0.13%), Russian ($116,328, a difference of 0.15%), Latvian ($115,957, a difference of 0.17%), Immigrants from Switzerland ($115,934, a difference of 0.19%), and Immigrants from Asia ($116,566, a difference of 0.35%).
| Demographics | Rating | Rank | Householder Income Ages 45 - 64 years |
| Immigrants | Sweden | 100.0 /100 | #26 | Exceptional $118,318 |
| Immigrants | Northern Europe | 100.0 /100 | #27 | Exceptional $117,930 |
| Turks | 100.0 /100 | #28 | Exceptional $117,814 |
| Bhutanese | 100.0 /100 | #29 | Exceptional $117,750 |
| Immigrants | Bolivia | 100.0 /100 | #30 | Exceptional $117,731 |
| Immigrants | Asia | 100.0 /100 | #31 | Exceptional $116,566 |
| Russians | 100.0 /100 | #32 | Exceptional $116,328 |
| Chinese | 100.0 /100 | #33 | Exceptional $116,156 |
| Immigrants | Denmark | 100.0 /100 | #34 | Exceptional $116,000 |
| Latvians | 100.0 /100 | #35 | Exceptional $115,957 |
| Immigrants | Switzerland | 100.0 /100 | #36 | Exceptional $115,934 |
| Maltese | 99.9 /100 | #37 | Exceptional $114,754 |
| Immigrants | Pakistan | 99.9 /100 | #38 | Exceptional $114,434 |
| Immigrants | Turkey | 99.9 /100 | #39 | Exceptional $114,407 |
| Cambodians | 99.9 /100 | #40 | Exceptional $114,342 |