Ute vs Immigrants from Burma/Myanmar 2nd Grade
COMPARE
Ute
Immigrants from Burma/Myanmar
2nd Grade
2nd Grade Comparison
Ute
Immigrants from Burma/Myanmar
98.1%
2ND GRADE
95.7/ 100
METRIC RATING
117th/ 347
METRIC RANK
96.7%
2ND GRADE
0.0/ 100
METRIC RATING
321st/ 347
METRIC RANK
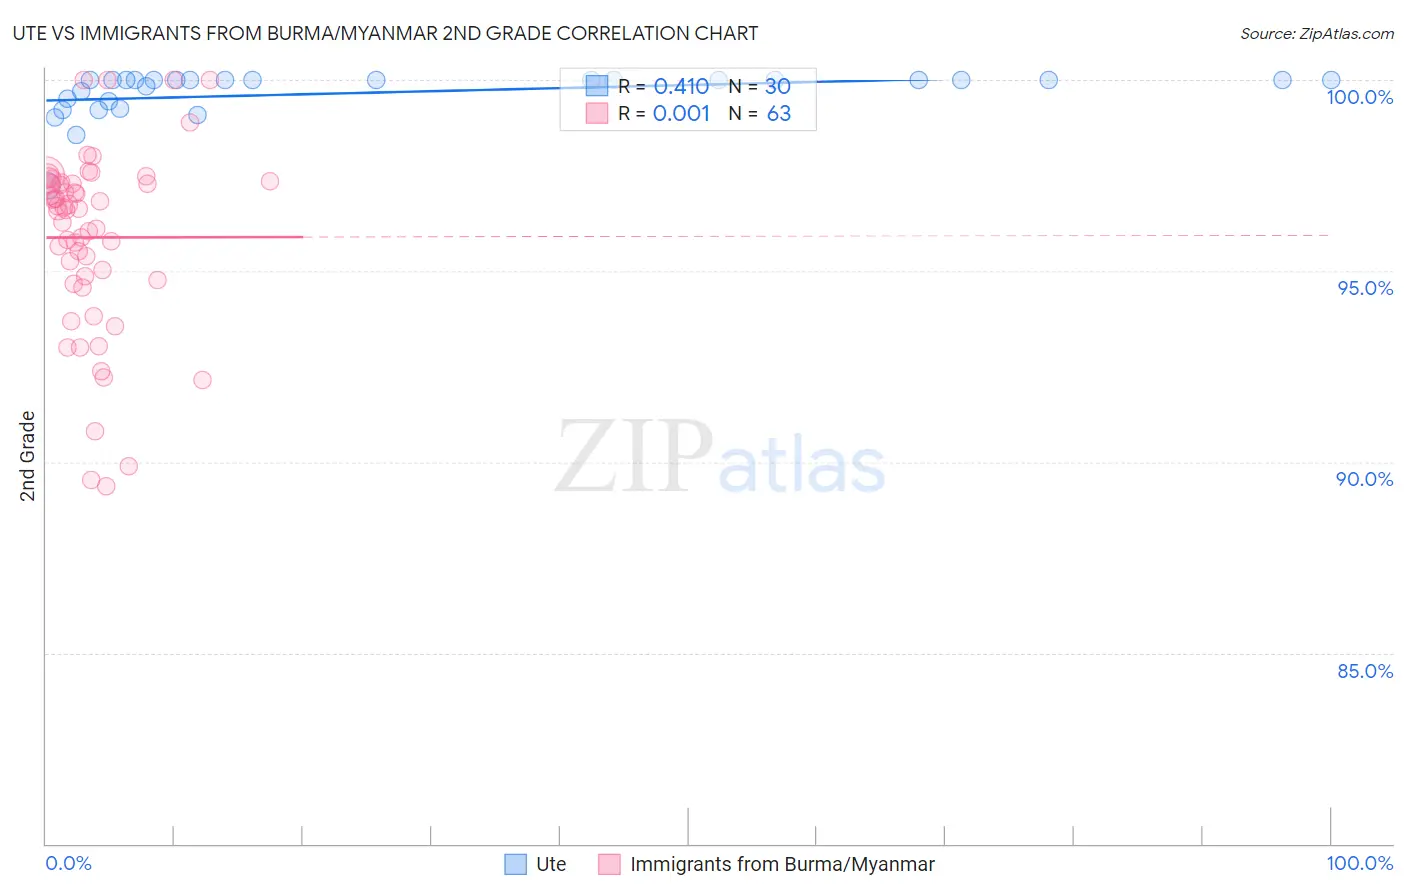
Ute vs Immigrants from Burma/Myanmar 2nd Grade Correlation Chart
The statistical analysis conducted on geographies consisting of 55,667,712 people shows a moderate positive correlation between the proportion of Ute and percentage of population with at least 2nd grade education in the United States with a correlation coefficient (R) of 0.410 and weighted average of 98.1%. Similarly, the statistical analysis conducted on geographies consisting of 172,338,093 people shows no correlation between the proportion of Immigrants from Burma/Myanmar and percentage of population with at least 2nd grade education in the United States with a correlation coefficient (R) of 0.001 and weighted average of 96.7%, a difference of 1.4%.
2nd Grade Correlation Summary
| Measurement | Ute | Immigrants from Burma/Myanmar |
| Minimum | 97.2% | 89.4% |
| Maximum | 100.0% | 100.0% |
| Range | 2.8% | 10.6% |
| Mean | 99.7% | 95.9% |
| Median | 100.0% | 96.6% |
| Interquartile 25% (IQ1) | 99.5% | 94.8% |
| Interquartile 75% (IQ3) | 100.0% | 97.3% |
| Interquartile Range (IQR) | 0.54% | 2.5% |
| Standard Deviation (Sample) | 0.61% | 2.4% |
| Standard Deviation (Population) | 0.60% | 2.4% |
Similar Demographics by 2nd Grade
Demographics Similar to Ute by 2nd Grade
In terms of 2nd grade, the demographic groups most similar to Ute are Spanish (98.1%, a difference of 0.0%), Immigrants from France (98.1%, a difference of 0.0%), Iranian (98.1%, a difference of 0.010%), Thai (98.1%, a difference of 0.010%), and Okinawan (98.1%, a difference of 0.010%).
| Demographics | Rating | Rank | 2nd Grade |
| Immigrants | Singapore | 97.0 /100 | #110 | Exceptional 98.1% |
| Immigrants | Czechoslovakia | 96.9 /100 | #111 | Exceptional 98.1% |
| Colville | 96.6 /100 | #112 | Exceptional 98.1% |
| Immigrants | Norway | 96.5 /100 | #113 | Exceptional 98.1% |
| Immigrants | Latvia | 96.4 /100 | #114 | Exceptional 98.1% |
| Iranians | 95.9 /100 | #115 | Exceptional 98.1% |
| Spanish | 95.8 /100 | #116 | Exceptional 98.1% |
| Ute | 95.7 /100 | #117 | Exceptional 98.1% |
| Immigrants | France | 95.6 /100 | #118 | Exceptional 98.1% |
| Thais | 95.3 /100 | #119 | Exceptional 98.1% |
| Okinawans | 94.9 /100 | #120 | Exceptional 98.1% |
| Immigrants | Zimbabwe | 94.4 /100 | #121 | Exceptional 98.1% |
| Lebanese | 94.2 /100 | #122 | Exceptional 98.1% |
| Immigrants | Japan | 94.1 /100 | #123 | Exceptional 98.1% |
| Menominee | 94.1 /100 | #124 | Exceptional 98.1% |
Demographics Similar to Immigrants from Burma/Myanmar by 2nd Grade
In terms of 2nd grade, the demographic groups most similar to Immigrants from Burma/Myanmar are Immigrants from Guyana (96.7%, a difference of 0.0%), Honduran (96.7%, a difference of 0.010%), Immigrants from Laos (96.7%, a difference of 0.010%), Indonesian (96.7%, a difference of 0.010%), and Immigrants from Nicaragua (96.7%, a difference of 0.010%).
| Demographics | Rating | Rank | 2nd Grade |
| Immigrants | Ecuador | 0.0 /100 | #314 | Tragic 96.8% |
| Immigrants | Belize | 0.0 /100 | #315 | Tragic 96.8% |
| Hondurans | 0.0 /100 | #316 | Tragic 96.7% |
| Immigrants | Laos | 0.0 /100 | #317 | Tragic 96.7% |
| Indonesians | 0.0 /100 | #318 | Tragic 96.7% |
| Immigrants | Nicaragua | 0.0 /100 | #319 | Tragic 96.7% |
| Immigrants | Guyana | 0.0 /100 | #320 | Tragic 96.7% |
| Immigrants | Burma/Myanmar | 0.0 /100 | #321 | Tragic 96.7% |
| Immigrants | Bangladesh | 0.0 /100 | #322 | Tragic 96.7% |
| Vietnamese | 0.0 /100 | #323 | Tragic 96.7% |
| Mexican American Indians | 0.0 /100 | #324 | Tragic 96.7% |
| Dominicans | 0.0 /100 | #325 | Tragic 96.6% |
| Immigrants | Honduras | 0.0 /100 | #326 | Tragic 96.6% |
| Immigrants | Vietnam | 0.0 /100 | #327 | Tragic 96.5% |
| Mexicans | 0.0 /100 | #328 | Tragic 96.5% |