Belizean vs Immigrants from Burma/Myanmar Householder Income Ages 45 - 64 years
COMPARE
Belizean
Immigrants from Burma/Myanmar
Householder Income Ages 45 - 64 years
Householder Income Ages 45 - 64 years Comparison
Belizeans
Immigrants from Burma/Myanmar
$88,684
HOUSEHOLDER INCOME AGES 45 - 64 YEARS
0.3/ 100
METRIC RATING
261st/ 347
METRIC RANK
$91,385
HOUSEHOLDER INCOME AGES 45 - 64 YEARS
1.1/ 100
METRIC RATING
240th/ 347
METRIC RANK
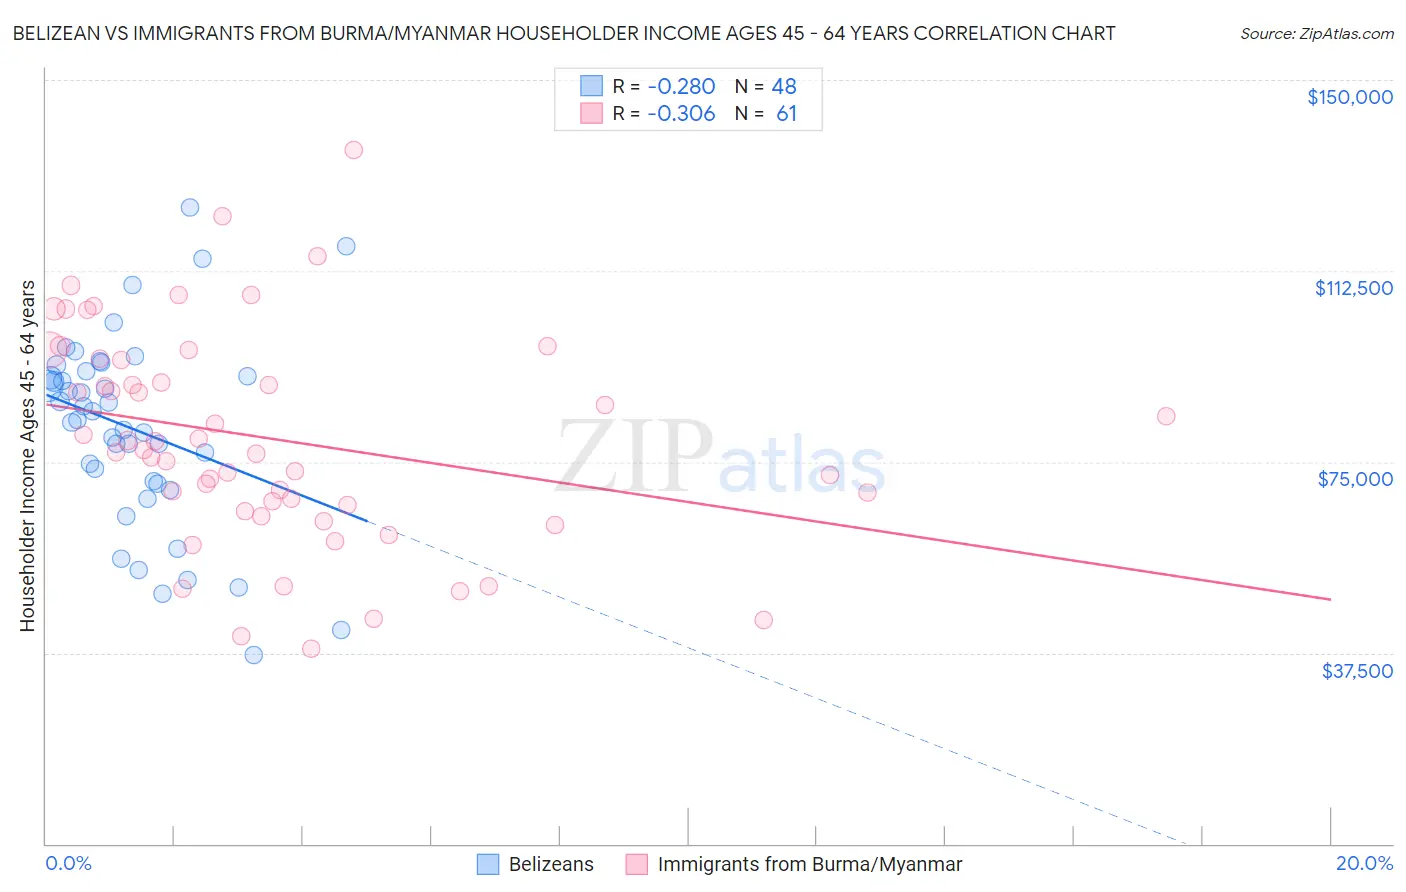
Belizean vs Immigrants from Burma/Myanmar Householder Income Ages 45 - 64 years Correlation Chart
The statistical analysis conducted on geographies consisting of 144,082,540 people shows a weak negative correlation between the proportion of Belizeans and household income with householder between the ages 45 and 64 in the United States with a correlation coefficient (R) of -0.280 and weighted average of $88,684. Similarly, the statistical analysis conducted on geographies consisting of 172,192,381 people shows a mild negative correlation between the proportion of Immigrants from Burma/Myanmar and household income with householder between the ages 45 and 64 in the United States with a correlation coefficient (R) of -0.306 and weighted average of $91,385, a difference of 3.0%.
Householder Income Ages 45 - 64 years Correlation Summary
| Measurement | Belizean | Immigrants from Burma/Myanmar |
| Minimum | $37,000 | $38,314 |
| Maximum | $124,977 | $136,250 |
| Range | $87,977 | $97,936 |
| Mean | $81,502 | $79,553 |
| Median | $84,116 | $77,270 |
| Interquartile 25% (IQ1) | $70,959 | $66,032 |
| Interquartile 75% (IQ3) | $92,338 | $95,170 |
| Interquartile Range (IQR) | $21,379 | $29,138 |
| Standard Deviation (Sample) | $18,999 | $21,018 |
| Standard Deviation (Population) | $18,800 | $20,845 |
Similar Demographics by Householder Income Ages 45 - 64 years
Demographics Similar to Belizeans by Householder Income Ages 45 - 64 years
In terms of householder income ages 45 - 64 years, the demographic groups most similar to Belizeans are Somali ($88,600, a difference of 0.090%), Liberian ($88,929, a difference of 0.28%), Immigrants from Senegal ($88,421, a difference of 0.30%), Osage ($88,390, a difference of 0.33%), and Jamaican ($88,327, a difference of 0.40%).
| Demographics | Rating | Rank | Householder Income Ages 45 - 64 years |
| Immigrants | Guyana | 0.6 /100 | #254 | Tragic $90,186 |
| West Indians | 0.5 /100 | #255 | Tragic $89,906 |
| French American Indians | 0.5 /100 | #256 | Tragic $89,811 |
| German Russians | 0.4 /100 | #257 | Tragic $89,398 |
| Immigrants | Barbados | 0.4 /100 | #258 | Tragic $89,394 |
| Immigrants | Nicaragua | 0.4 /100 | #259 | Tragic $89,108 |
| Liberians | 0.3 /100 | #260 | Tragic $88,929 |
| Belizeans | 0.3 /100 | #261 | Tragic $88,684 |
| Somalis | 0.3 /100 | #262 | Tragic $88,600 |
| Immigrants | Senegal | 0.3 /100 | #263 | Tragic $88,421 |
| Osage | 0.3 /100 | #264 | Tragic $88,390 |
| Jamaicans | 0.2 /100 | #265 | Tragic $88,327 |
| Immigrants | West Indies | 0.2 /100 | #266 | Tragic $88,164 |
| Hmong | 0.2 /100 | #267 | Tragic $88,115 |
| Immigrants | Micronesia | 0.2 /100 | #268 | Tragic $87,864 |
Demographics Similar to Immigrants from Burma/Myanmar by Householder Income Ages 45 - 64 years
In terms of householder income ages 45 - 64 years, the demographic groups most similar to Immigrants from Burma/Myanmar are Trinidadian and Tobagonian ($91,357, a difference of 0.030%), Inupiat ($91,355, a difference of 0.030%), Immigrants from Trinidad and Tobago ($91,347, a difference of 0.040%), Immigrants from Ecuador ($91,462, a difference of 0.080%), and Immigrants from Middle Africa ($91,293, a difference of 0.10%).
| Demographics | Rating | Rank | Householder Income Ages 45 - 64 years |
| Nepalese | 3.0 /100 | #233 | Tragic $93,355 |
| Immigrants | El Salvador | 2.7 /100 | #234 | Tragic $93,176 |
| Nicaraguans | 2.0 /100 | #235 | Tragic $92,554 |
| Immigrants | Western Africa | 1.8 /100 | #236 | Tragic $92,384 |
| Immigrants | Bangladesh | 1.7 /100 | #237 | Tragic $92,208 |
| Pennsylvania Germans | 1.5 /100 | #238 | Tragic $91,956 |
| Immigrants | Ecuador | 1.2 /100 | #239 | Tragic $91,462 |
| Immigrants | Burma/Myanmar | 1.1 /100 | #240 | Tragic $91,385 |
| Trinidadians and Tobagonians | 1.1 /100 | #241 | Tragic $91,357 |
| Inupiat | 1.1 /100 | #242 | Tragic $91,355 |
| Immigrants | Trinidad and Tobago | 1.1 /100 | #243 | Tragic $91,347 |
| Immigrants | Middle Africa | 1.1 /100 | #244 | Tragic $91,293 |
| Guyanese | 0.9 /100 | #245 | Tragic $90,966 |
| Central Americans | 0.9 /100 | #246 | Tragic $90,951 |
| Alaskan Athabascans | 0.9 /100 | #247 | Tragic $90,951 |