Ute vs Immigrants from Guatemala Householder Income Ages 45 - 64 years
COMPARE
Ute
Immigrants from Guatemala
Householder Income Ages 45 - 64 years
Householder Income Ages 45 - 64 years Comparison
Ute
Immigrants from Guatemala
$83,937
HOUSEHOLDER INCOME AGES 45 - 64 YEARS
0.0/ 100
METRIC RATING
306th/ 347
METRIC RANK
$86,573
HOUSEHOLDER INCOME AGES 45 - 64 YEARS
0.1/ 100
METRIC RATING
286th/ 347
METRIC RANK
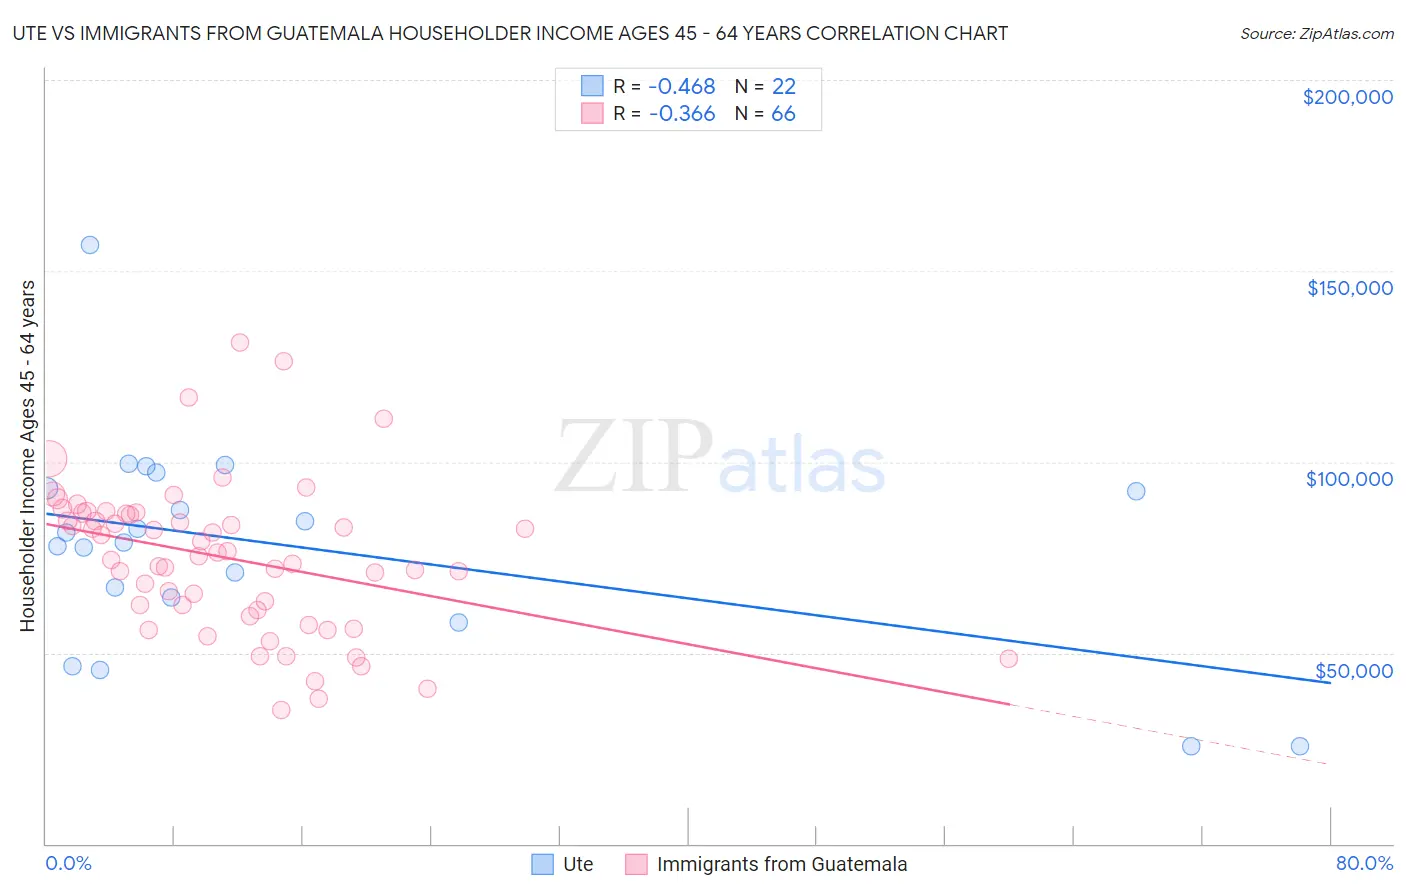
Ute vs Immigrants from Guatemala Householder Income Ages 45 - 64 years Correlation Chart
The statistical analysis conducted on geographies consisting of 55,640,692 people shows a moderate negative correlation between the proportion of Ute and household income with householder between the ages 45 and 64 in the United States with a correlation coefficient (R) of -0.468 and weighted average of $83,937. Similarly, the statistical analysis conducted on geographies consisting of 376,817,889 people shows a mild negative correlation between the proportion of Immigrants from Guatemala and household income with householder between the ages 45 and 64 in the United States with a correlation coefficient (R) of -0.366 and weighted average of $86,573, a difference of 3.1%.
Householder Income Ages 45 - 64 years Correlation Summary
| Measurement | Ute | Immigrants from Guatemala |
| Minimum | $25,694 | $34,910 |
| Maximum | $156,708 | $131,185 |
| Range | $131,014 | $96,275 |
| Mean | $77,764 | $74,838 |
| Median | $80,253 | $75,675 |
| Interquartile 25% (IQ1) | $64,449 | $61,091 |
| Interquartile 75% (IQ3) | $93,045 | $86,426 |
| Interquartile Range (IQR) | $28,595 | $25,336 |
| Standard Deviation (Sample) | $28,260 | $19,729 |
| Standard Deviation (Population) | $27,610 | $19,579 |
Demographics Similar to Ute and Immigrants from Guatemala by Householder Income Ages 45 - 64 years
In terms of householder income ages 45 - 64 years, the demographic groups most similar to Ute are Chippewa ($83,943, a difference of 0.010%), Ottawa ($83,953, a difference of 0.020%), Honduran ($84,079, a difference of 0.17%), Haitian ($84,384, a difference of 0.53%), and Potawatomi ($84,613, a difference of 0.81%). Similarly, the demographic groups most similar to Immigrants from Guatemala are Bangladeshi ($86,402, a difference of 0.20%), Immigrants from St. Vincent and the Grenadines ($86,394, a difference of 0.21%), Cuban ($86,301, a difference of 0.32%), Cherokee ($86,125, a difference of 0.52%), and Hispanic or Latino ($86,006, a difference of 0.66%).
| Demographics | Rating | Rank | Householder Income Ages 45 - 64 years |
| Immigrants | Guatemala | 0.1 /100 | #286 | Tragic $86,573 |
| Bangladeshis | 0.1 /100 | #287 | Tragic $86,402 |
| Immigrants | St. Vincent and the Grenadines | 0.1 /100 | #288 | Tragic $86,394 |
| Cubans | 0.1 /100 | #289 | Tragic $86,301 |
| Cherokee | 0.1 /100 | #290 | Tragic $86,125 |
| Hispanics or Latinos | 0.1 /100 | #291 | Tragic $86,006 |
| Immigrants | Central America | 0.1 /100 | #292 | Tragic $85,965 |
| Comanche | 0.1 /100 | #293 | Tragic $85,787 |
| British West Indians | 0.1 /100 | #294 | Tragic $85,571 |
| Immigrants | Grenada | 0.1 /100 | #295 | Tragic $85,552 |
| Immigrants | Zaire | 0.1 /100 | #296 | Tragic $85,207 |
| Fijians | 0.1 /100 | #297 | Tragic $85,187 |
| Africans | 0.0 /100 | #298 | Tragic $84,925 |
| Immigrants | Mexico | 0.0 /100 | #299 | Tragic $84,910 |
| Indonesians | 0.0 /100 | #300 | Tragic $84,890 |
| Potawatomi | 0.0 /100 | #301 | Tragic $84,613 |
| Haitians | 0.0 /100 | #302 | Tragic $84,384 |
| Hondurans | 0.0 /100 | #303 | Tragic $84,079 |
| Ottawa | 0.0 /100 | #304 | Tragic $83,953 |
| Chippewa | 0.0 /100 | #305 | Tragic $83,943 |
| Ute | 0.0 /100 | #306 | Tragic $83,937 |