Immigrants from South America vs Immigrants from Burma/Myanmar Householder Income Ages 45 - 64 years
COMPARE
Immigrants from South America
Immigrants from Burma/Myanmar
Householder Income Ages 45 - 64 years
Householder Income Ages 45 - 64 years Comparison
Immigrants from South America
Immigrants from Burma/Myanmar
$99,126
HOUSEHOLDER INCOME AGES 45 - 64 YEARS
35.4/ 100
METRIC RATING
189th/ 347
METRIC RANK
$91,385
HOUSEHOLDER INCOME AGES 45 - 64 YEARS
1.1/ 100
METRIC RATING
240th/ 347
METRIC RANK
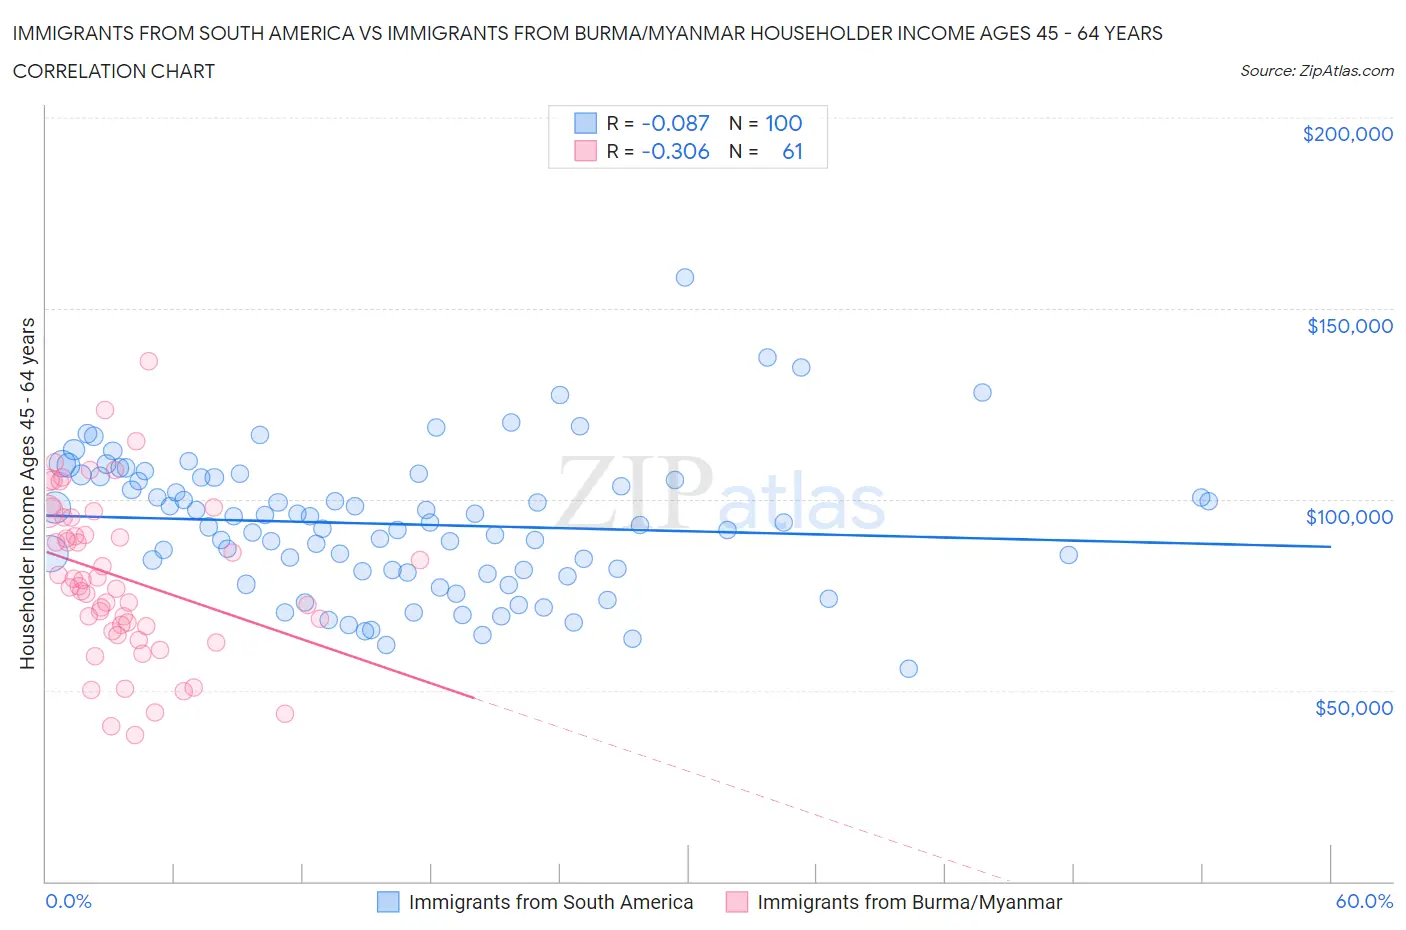
Immigrants from South America vs Immigrants from Burma/Myanmar Householder Income Ages 45 - 64 years Correlation Chart
The statistical analysis conducted on geographies consisting of 485,109,583 people shows a slight negative correlation between the proportion of Immigrants from South America and household income with householder between the ages 45 and 64 in the United States with a correlation coefficient (R) of -0.087 and weighted average of $99,126. Similarly, the statistical analysis conducted on geographies consisting of 172,192,381 people shows a mild negative correlation between the proportion of Immigrants from Burma/Myanmar and household income with householder between the ages 45 and 64 in the United States with a correlation coefficient (R) of -0.306 and weighted average of $91,385, a difference of 8.5%.
Householder Income Ages 45 - 64 years Correlation Summary
| Measurement | Immigrants from South America | Immigrants from Burma/Myanmar |
| Minimum | $55,625 | $38,314 |
| Maximum | $158,009 | $136,250 |
| Range | $102,384 | $97,936 |
| Mean | $93,526 | $79,553 |
| Median | $93,699 | $77,270 |
| Interquartile 25% (IQ1) | $80,877 | $66,032 |
| Interquartile 75% (IQ3) | $105,801 | $95,170 |
| Interquartile Range (IQR) | $24,923 | $29,138 |
| Standard Deviation (Sample) | $18,231 | $21,018 |
| Standard Deviation (Population) | $18,139 | $20,845 |
Similar Demographics by Householder Income Ages 45 - 64 years
Demographics Similar to Immigrants from South America by Householder Income Ages 45 - 64 years
In terms of householder income ages 45 - 64 years, the demographic groups most similar to Immigrants from South America are French Canadian ($99,093, a difference of 0.030%), Immigrants from Portugal ($99,203, a difference of 0.080%), Kenyan ($98,970, a difference of 0.16%), Celtic ($98,896, a difference of 0.23%), and Iraqi ($99,387, a difference of 0.26%).
| Demographics | Rating | Rank | Householder Income Ages 45 - 64 years |
| Finns | 44.8 /100 | #182 | Average $99,904 |
| Spaniards | 44.6 /100 | #183 | Average $99,889 |
| French | 43.8 /100 | #184 | Average $99,824 |
| Colombians | 43.2 /100 | #185 | Average $99,772 |
| Dutch | 41.7 /100 | #186 | Average $99,650 |
| Iraqis | 38.5 /100 | #187 | Fair $99,387 |
| Immigrants | Portugal | 36.3 /100 | #188 | Fair $99,203 |
| Immigrants | South America | 35.4 /100 | #189 | Fair $99,126 |
| French Canadians | 35.1 /100 | #190 | Fair $99,093 |
| Kenyans | 33.7 /100 | #191 | Fair $98,970 |
| Celtics | 32.9 /100 | #192 | Fair $98,896 |
| Hawaiians | 31.6 /100 | #193 | Fair $98,778 |
| Uruguayans | 30.3 /100 | #194 | Fair $98,660 |
| Spanish | 29.2 /100 | #195 | Fair $98,554 |
| Immigrants | Eastern Africa | 28.3 /100 | #196 | Fair $98,467 |
Demographics Similar to Immigrants from Burma/Myanmar by Householder Income Ages 45 - 64 years
In terms of householder income ages 45 - 64 years, the demographic groups most similar to Immigrants from Burma/Myanmar are Trinidadian and Tobagonian ($91,357, a difference of 0.030%), Inupiat ($91,355, a difference of 0.030%), Immigrants from Trinidad and Tobago ($91,347, a difference of 0.040%), Immigrants from Ecuador ($91,462, a difference of 0.080%), and Immigrants from Middle Africa ($91,293, a difference of 0.10%).
| Demographics | Rating | Rank | Householder Income Ages 45 - 64 years |
| Nepalese | 3.0 /100 | #233 | Tragic $93,355 |
| Immigrants | El Salvador | 2.7 /100 | #234 | Tragic $93,176 |
| Nicaraguans | 2.0 /100 | #235 | Tragic $92,554 |
| Immigrants | Western Africa | 1.8 /100 | #236 | Tragic $92,384 |
| Immigrants | Bangladesh | 1.7 /100 | #237 | Tragic $92,208 |
| Pennsylvania Germans | 1.5 /100 | #238 | Tragic $91,956 |
| Immigrants | Ecuador | 1.2 /100 | #239 | Tragic $91,462 |
| Immigrants | Burma/Myanmar | 1.1 /100 | #240 | Tragic $91,385 |
| Trinidadians and Tobagonians | 1.1 /100 | #241 | Tragic $91,357 |
| Inupiat | 1.1 /100 | #242 | Tragic $91,355 |
| Immigrants | Trinidad and Tobago | 1.1 /100 | #243 | Tragic $91,347 |
| Immigrants | Middle Africa | 1.1 /100 | #244 | Tragic $91,293 |
| Guyanese | 0.9 /100 | #245 | Tragic $90,966 |
| Central Americans | 0.9 /100 | #246 | Tragic $90,951 |
| Alaskan Athabascans | 0.9 /100 | #247 | Tragic $90,951 |