Ute vs Immigrants from Colombia Householder Income Ages 45 - 64 years
COMPARE
Ute
Immigrants from Colombia
Householder Income Ages 45 - 64 years
Householder Income Ages 45 - 64 years Comparison
Ute
Immigrants from Colombia
$83,937
HOUSEHOLDER INCOME AGES 45 - 64 YEARS
0.0/ 100
METRIC RATING
306th/ 347
METRIC RANK
$97,290
HOUSEHOLDER INCOME AGES 45 - 64 YEARS
18.0/ 100
METRIC RATING
205th/ 347
METRIC RANK
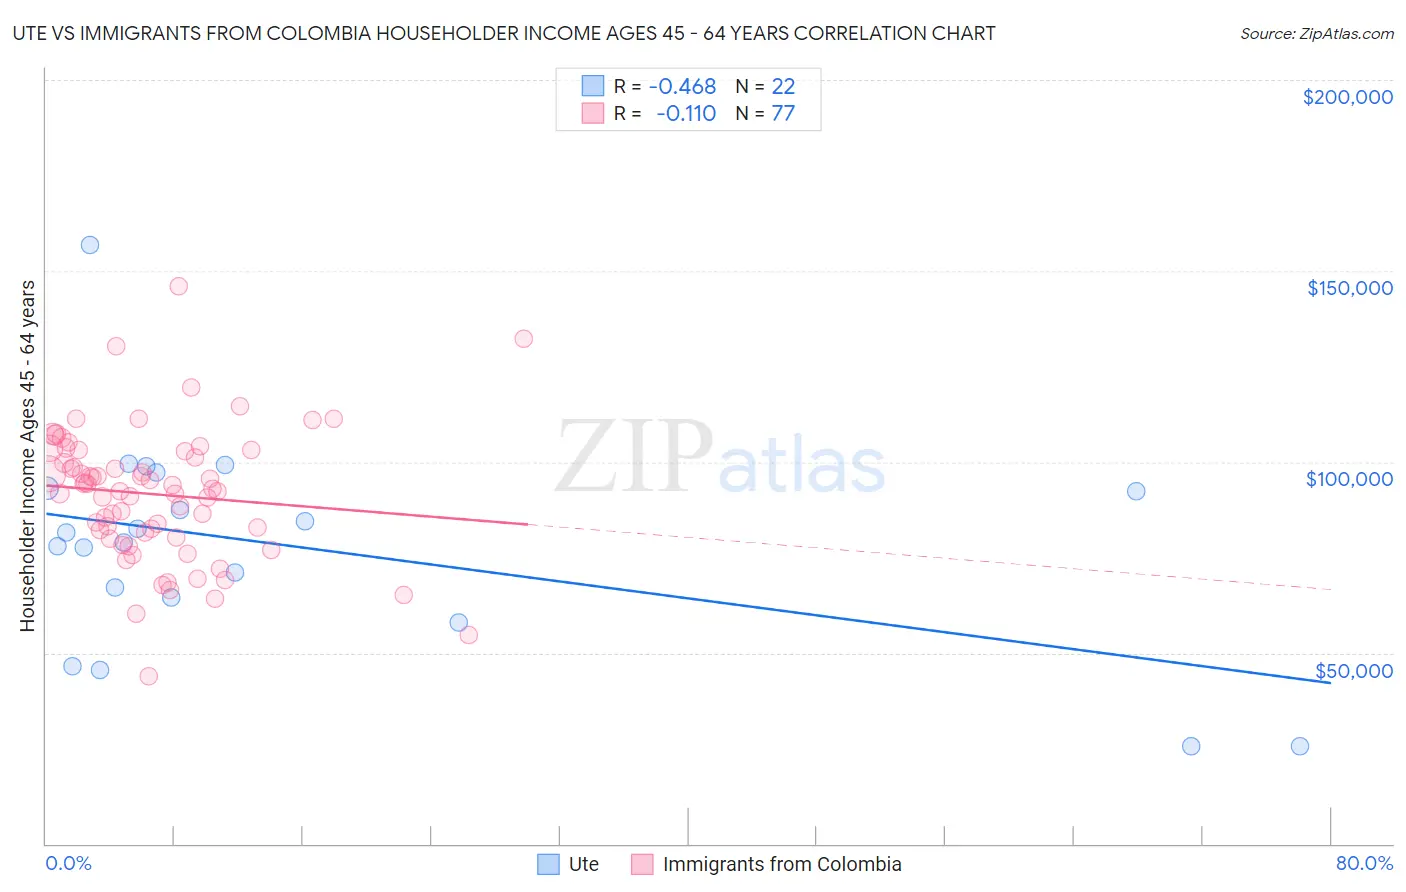
Ute vs Immigrants from Colombia Householder Income Ages 45 - 64 years Correlation Chart
The statistical analysis conducted on geographies consisting of 55,640,692 people shows a moderate negative correlation between the proportion of Ute and household income with householder between the ages 45 and 64 in the United States with a correlation coefficient (R) of -0.468 and weighted average of $83,937. Similarly, the statistical analysis conducted on geographies consisting of 378,202,708 people shows a poor negative correlation between the proportion of Immigrants from Colombia and household income with householder between the ages 45 and 64 in the United States with a correlation coefficient (R) of -0.110 and weighted average of $97,290, a difference of 15.9%.
Householder Income Ages 45 - 64 years Correlation Summary
| Measurement | Ute | Immigrants from Colombia |
| Minimum | $25,694 | $43,836 |
| Maximum | $156,708 | $145,834 |
| Range | $131,014 | $101,997 |
| Mean | $77,764 | $91,511 |
| Median | $80,253 | $92,961 |
| Interquartile 25% (IQ1) | $64,449 | $80,871 |
| Interquartile 75% (IQ3) | $93,045 | $102,915 |
| Interquartile Range (IQR) | $28,595 | $22,044 |
| Standard Deviation (Sample) | $28,260 | $17,364 |
| Standard Deviation (Population) | $27,610 | $17,251 |
Similar Demographics by Householder Income Ages 45 - 64 years
Demographics Similar to Ute by Householder Income Ages 45 - 64 years
In terms of householder income ages 45 - 64 years, the demographic groups most similar to Ute are Chippewa ($83,943, a difference of 0.010%), Ottawa ($83,953, a difference of 0.020%), Honduran ($84,079, a difference of 0.17%), Shoshone ($83,588, a difference of 0.42%), and Immigrants from Cabo Verde ($83,542, a difference of 0.47%).
| Demographics | Rating | Rank | Householder Income Ages 45 - 64 years |
| Immigrants | Mexico | 0.0 /100 | #299 | Tragic $84,910 |
| Indonesians | 0.0 /100 | #300 | Tragic $84,890 |
| Potawatomi | 0.0 /100 | #301 | Tragic $84,613 |
| Haitians | 0.0 /100 | #302 | Tragic $84,384 |
| Hondurans | 0.0 /100 | #303 | Tragic $84,079 |
| Ottawa | 0.0 /100 | #304 | Tragic $83,953 |
| Chippewa | 0.0 /100 | #305 | Tragic $83,943 |
| Ute | 0.0 /100 | #306 | Tragic $83,937 |
| Shoshone | 0.0 /100 | #307 | Tragic $83,588 |
| Immigrants | Cabo Verde | 0.0 /100 | #308 | Tragic $83,542 |
| Immigrants | Dominica | 0.0 /100 | #309 | Tragic $83,311 |
| Immigrants | Haiti | 0.0 /100 | #310 | Tragic $83,257 |
| Immigrants | Bahamas | 0.0 /100 | #311 | Tragic $83,177 |
| Cajuns | 0.0 /100 | #312 | Tragic $83,015 |
| U.S. Virgin Islanders | 0.0 /100 | #313 | Tragic $82,736 |
Demographics Similar to Immigrants from Colombia by Householder Income Ages 45 - 64 years
In terms of householder income ages 45 - 64 years, the demographic groups most similar to Immigrants from Colombia are Immigrants from Africa ($97,284, a difference of 0.010%), Ghanaian ($97,277, a difference of 0.010%), Immigrants from Eritrea ($97,373, a difference of 0.090%), Immigrants from Thailand ($97,400, a difference of 0.11%), and Tlingit-Haida ($97,417, a difference of 0.13%).
| Demographics | Rating | Rank | Householder Income Ages 45 - 64 years |
| Immigrants | Iraq | 25.7 /100 | #198 | Fair $98,201 |
| Whites/Caucasians | 24.6 /100 | #199 | Fair $98,091 |
| Immigrants | Kenya | 23.5 /100 | #200 | Fair $97,964 |
| Yugoslavians | 20.0 /100 | #201 | Fair $97,558 |
| Tlingit-Haida | 18.9 /100 | #202 | Poor $97,417 |
| Immigrants | Thailand | 18.8 /100 | #203 | Poor $97,400 |
| Immigrants | Eritrea | 18.6 /100 | #204 | Poor $97,373 |
| Immigrants | Colombia | 18.0 /100 | #205 | Poor $97,290 |
| Immigrants | Africa | 17.9 /100 | #206 | Poor $97,284 |
| Ghanaians | 17.9 /100 | #207 | Poor $97,277 |
| Scotch-Irish | 16.4 /100 | #208 | Poor $97,073 |
| Japanese | 14.8 /100 | #209 | Poor $96,834 |
| Tsimshian | 14.5 /100 | #210 | Poor $96,783 |
| Immigrants | Cambodia | 13.0 /100 | #211 | Poor $96,537 |
| Venezuelans | 12.6 /100 | #212 | Poor $96,460 |