Houma vs Immigrants from Burma/Myanmar Householder Income Ages 45 - 64 years
COMPARE
Houma
Immigrants from Burma/Myanmar
Householder Income Ages 45 - 64 years
Householder Income Ages 45 - 64 years Comparison
Houma
Immigrants from Burma/Myanmar
$72,093
HOUSEHOLDER INCOME AGES 45 - 64 YEARS
0.0/ 100
METRIC RATING
344th/ 347
METRIC RANK
$91,385
HOUSEHOLDER INCOME AGES 45 - 64 YEARS
1.1/ 100
METRIC RATING
240th/ 347
METRIC RANK
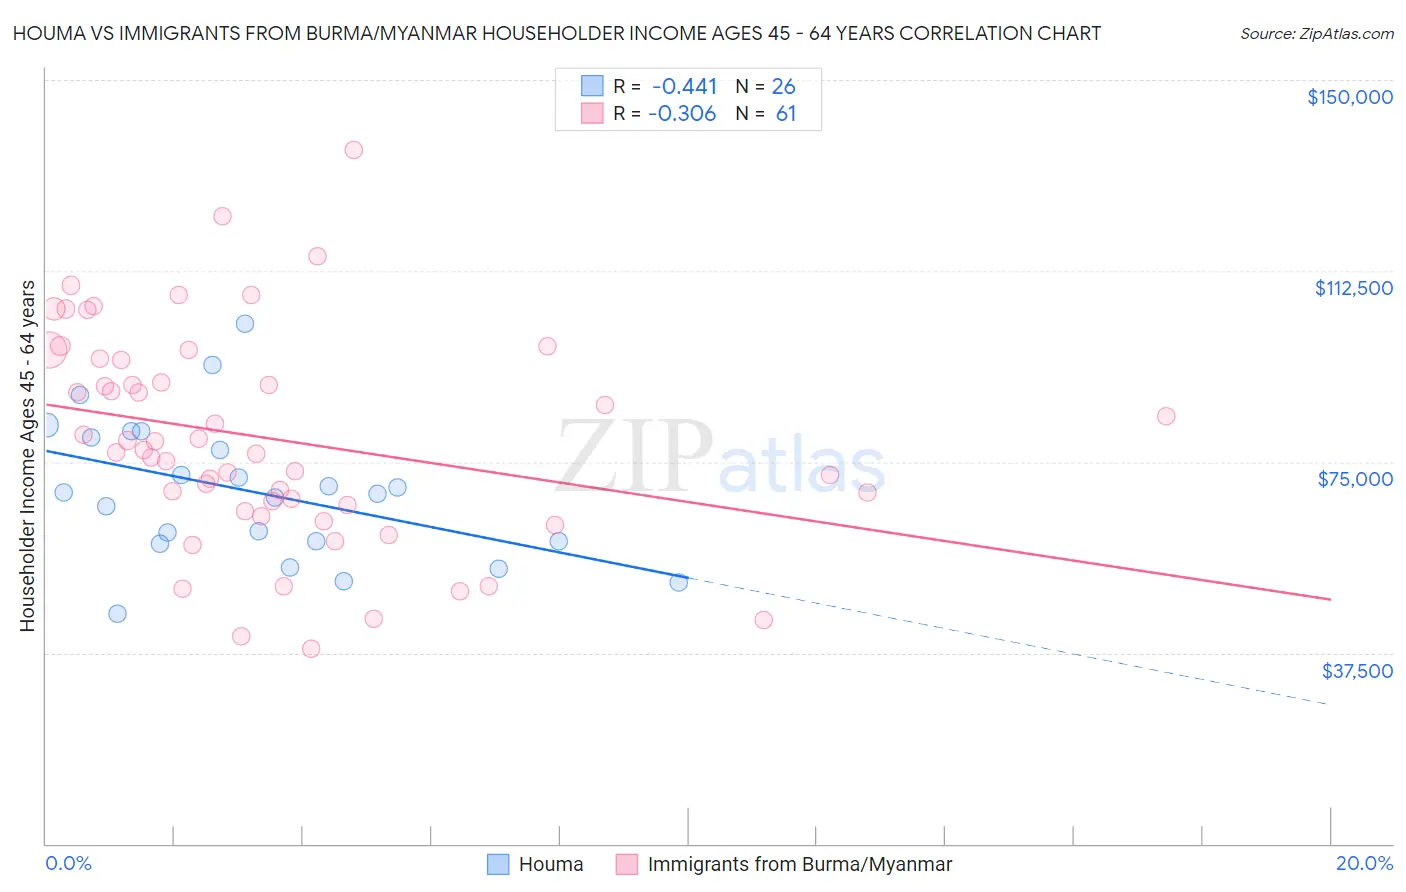
Houma vs Immigrants from Burma/Myanmar Householder Income Ages 45 - 64 years Correlation Chart
The statistical analysis conducted on geographies consisting of 36,775,541 people shows a moderate negative correlation between the proportion of Houma and household income with householder between the ages 45 and 64 in the United States with a correlation coefficient (R) of -0.441 and weighted average of $72,093. Similarly, the statistical analysis conducted on geographies consisting of 172,192,381 people shows a mild negative correlation between the proportion of Immigrants from Burma/Myanmar and household income with householder between the ages 45 and 64 in the United States with a correlation coefficient (R) of -0.306 and weighted average of $91,385, a difference of 26.8%.
Householder Income Ages 45 - 64 years Correlation Summary
| Measurement | Houma | Immigrants from Burma/Myanmar |
| Minimum | $45,223 | $38,314 |
| Maximum | $102,148 | $136,250 |
| Range | $56,925 | $97,936 |
| Mean | $69,210 | $79,553 |
| Median | $68,942 | $77,270 |
| Interquartile 25% (IQ1) | $59,348 | $66,032 |
| Interquartile 75% (IQ3) | $79,871 | $95,170 |
| Interquartile Range (IQR) | $20,523 | $29,138 |
| Standard Deviation (Sample) | $13,841 | $21,018 |
| Standard Deviation (Population) | $13,573 | $20,845 |
Similar Demographics by Householder Income Ages 45 - 64 years
Demographics Similar to Houma by Householder Income Ages 45 - 64 years
In terms of householder income ages 45 - 64 years, the demographic groups most similar to Houma are Pima ($73,365, a difference of 1.8%), Tohono O'odham ($73,774, a difference of 2.3%), Crow ($74,257, a difference of 3.0%), Navajo ($69,759, a difference of 3.4%), and Immigrants from Yemen ($74,575, a difference of 3.4%).
| Demographics | Rating | Rank | Householder Income Ages 45 - 64 years |
| Immigrants | Congo | 0.0 /100 | #333 | Tragic $77,850 |
| Menominee | 0.0 /100 | #334 | Tragic $76,903 |
| Cheyenne | 0.0 /100 | #335 | Tragic $76,362 |
| Arapaho | 0.0 /100 | #336 | Tragic $75,945 |
| Pueblo | 0.0 /100 | #337 | Tragic $75,601 |
| Hopi | 0.0 /100 | #338 | Tragic $75,562 |
| Kiowa | 0.0 /100 | #339 | Tragic $74,815 |
| Immigrants | Yemen | 0.0 /100 | #340 | Tragic $74,575 |
| Crow | 0.0 /100 | #341 | Tragic $74,257 |
| Tohono O'odham | 0.0 /100 | #342 | Tragic $73,774 |
| Pima | 0.0 /100 | #343 | Tragic $73,365 |
| Houma | 0.0 /100 | #344 | Tragic $72,093 |
| Navajo | 0.0 /100 | #345 | Tragic $69,759 |
| Puerto Ricans | 0.0 /100 | #346 | Tragic $69,234 |
| Lumbee | 0.0 /100 | #347 | Tragic $65,113 |
Demographics Similar to Immigrants from Burma/Myanmar by Householder Income Ages 45 - 64 years
In terms of householder income ages 45 - 64 years, the demographic groups most similar to Immigrants from Burma/Myanmar are Trinidadian and Tobagonian ($91,357, a difference of 0.030%), Inupiat ($91,355, a difference of 0.030%), Immigrants from Trinidad and Tobago ($91,347, a difference of 0.040%), Immigrants from Ecuador ($91,462, a difference of 0.080%), and Immigrants from Middle Africa ($91,293, a difference of 0.10%).
| Demographics | Rating | Rank | Householder Income Ages 45 - 64 years |
| Nepalese | 3.0 /100 | #233 | Tragic $93,355 |
| Immigrants | El Salvador | 2.7 /100 | #234 | Tragic $93,176 |
| Nicaraguans | 2.0 /100 | #235 | Tragic $92,554 |
| Immigrants | Western Africa | 1.8 /100 | #236 | Tragic $92,384 |
| Immigrants | Bangladesh | 1.7 /100 | #237 | Tragic $92,208 |
| Pennsylvania Germans | 1.5 /100 | #238 | Tragic $91,956 |
| Immigrants | Ecuador | 1.2 /100 | #239 | Tragic $91,462 |
| Immigrants | Burma/Myanmar | 1.1 /100 | #240 | Tragic $91,385 |
| Trinidadians and Tobagonians | 1.1 /100 | #241 | Tragic $91,357 |
| Inupiat | 1.1 /100 | #242 | Tragic $91,355 |
| Immigrants | Trinidad and Tobago | 1.1 /100 | #243 | Tragic $91,347 |
| Immigrants | Middle Africa | 1.1 /100 | #244 | Tragic $91,293 |
| Guyanese | 0.9 /100 | #245 | Tragic $90,966 |
| Central Americans | 0.9 /100 | #246 | Tragic $90,951 |
| Alaskan Athabascans | 0.9 /100 | #247 | Tragic $90,951 |