Ute vs Argentinean Householder Income Ages 45 - 64 years
COMPARE
Ute
Argentinean
Householder Income Ages 45 - 64 years
Householder Income Ages 45 - 64 years Comparison
Ute
Argentineans
$83,937
HOUSEHOLDER INCOME AGES 45 - 64 YEARS
0.0/ 100
METRIC RATING
306th/ 347
METRIC RANK
$110,103
HOUSEHOLDER INCOME AGES 45 - 64 YEARS
99.3/ 100
METRIC RATING
73rd/ 347
METRIC RANK
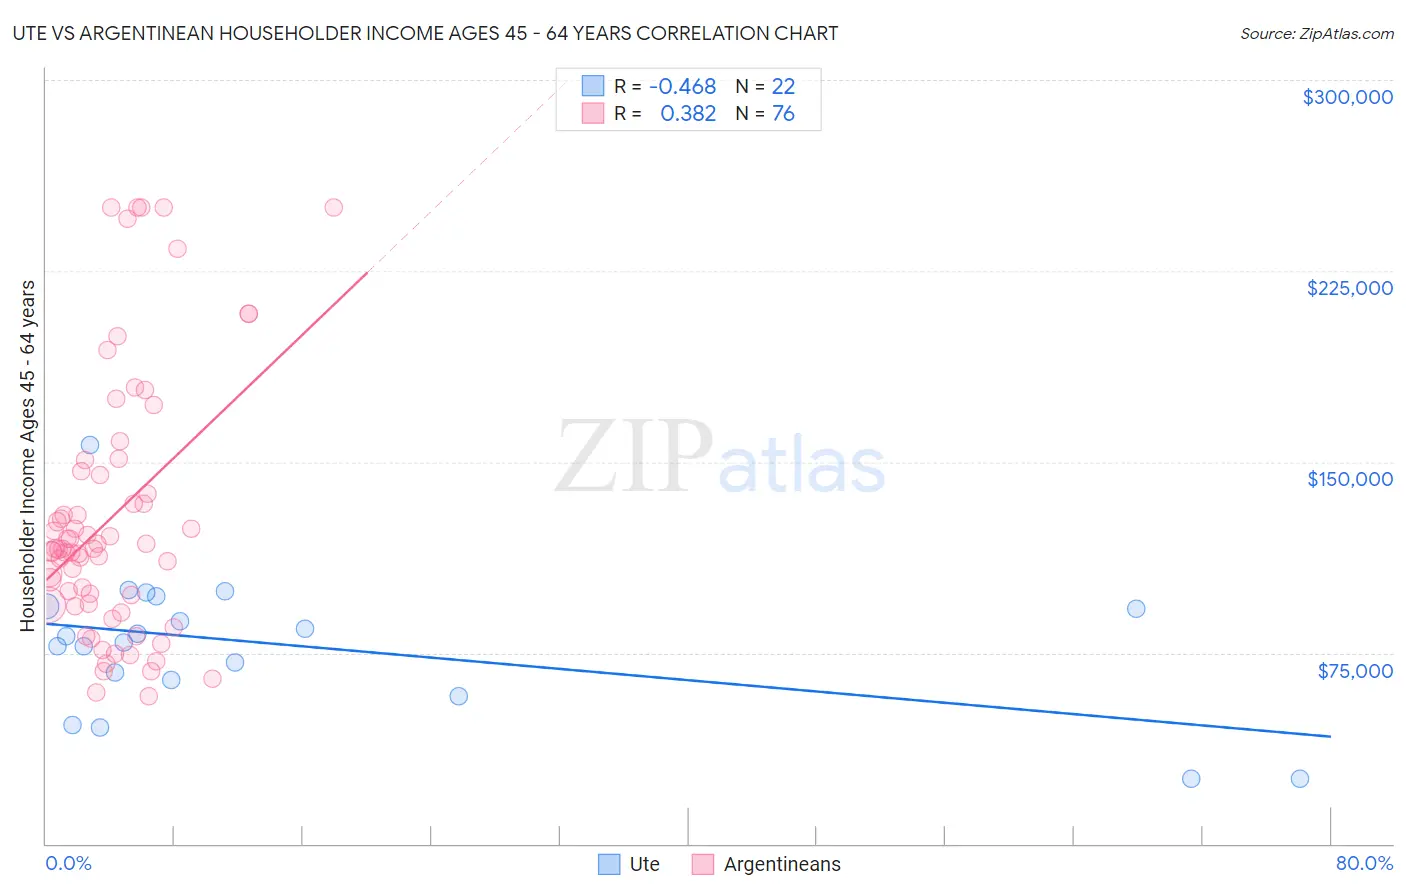
Ute vs Argentinean Householder Income Ages 45 - 64 years Correlation Chart
The statistical analysis conducted on geographies consisting of 55,640,692 people shows a moderate negative correlation between the proportion of Ute and household income with householder between the ages 45 and 64 in the United States with a correlation coefficient (R) of -0.468 and weighted average of $83,937. Similarly, the statistical analysis conducted on geographies consisting of 296,812,150 people shows a mild positive correlation between the proportion of Argentineans and household income with householder between the ages 45 and 64 in the United States with a correlation coefficient (R) of 0.382 and weighted average of $110,103, a difference of 31.2%.
Householder Income Ages 45 - 64 years Correlation Summary
| Measurement | Ute | Argentinean |
| Minimum | $25,694 | $57,969 |
| Maximum | $156,708 | $250,001 |
| Range | $131,014 | $192,032 |
| Mean | $77,764 | $128,288 |
| Median | $80,253 | $115,931 |
| Interquartile 25% (IQ1) | $64,449 | $94,003 |
| Interquartile 75% (IQ3) | $93,045 | $145,452 |
| Interquartile Range (IQR) | $28,595 | $51,448 |
| Standard Deviation (Sample) | $28,260 | $50,936 |
| Standard Deviation (Population) | $27,610 | $50,600 |
Similar Demographics by Householder Income Ages 45 - 64 years
Demographics Similar to Ute by Householder Income Ages 45 - 64 years
In terms of householder income ages 45 - 64 years, the demographic groups most similar to Ute are Chippewa ($83,943, a difference of 0.010%), Ottawa ($83,953, a difference of 0.020%), Honduran ($84,079, a difference of 0.17%), Shoshone ($83,588, a difference of 0.42%), and Immigrants from Cabo Verde ($83,542, a difference of 0.47%).
| Demographics | Rating | Rank | Householder Income Ages 45 - 64 years |
| Immigrants | Mexico | 0.0 /100 | #299 | Tragic $84,910 |
| Indonesians | 0.0 /100 | #300 | Tragic $84,890 |
| Potawatomi | 0.0 /100 | #301 | Tragic $84,613 |
| Haitians | 0.0 /100 | #302 | Tragic $84,384 |
| Hondurans | 0.0 /100 | #303 | Tragic $84,079 |
| Ottawa | 0.0 /100 | #304 | Tragic $83,953 |
| Chippewa | 0.0 /100 | #305 | Tragic $83,943 |
| Ute | 0.0 /100 | #306 | Tragic $83,937 |
| Shoshone | 0.0 /100 | #307 | Tragic $83,588 |
| Immigrants | Cabo Verde | 0.0 /100 | #308 | Tragic $83,542 |
| Immigrants | Dominica | 0.0 /100 | #309 | Tragic $83,311 |
| Immigrants | Haiti | 0.0 /100 | #310 | Tragic $83,257 |
| Immigrants | Bahamas | 0.0 /100 | #311 | Tragic $83,177 |
| Cajuns | 0.0 /100 | #312 | Tragic $83,015 |
| U.S. Virgin Islanders | 0.0 /100 | #313 | Tragic $82,736 |
Demographics Similar to Argentineans by Householder Income Ages 45 - 64 years
In terms of householder income ages 45 - 64 years, the demographic groups most similar to Argentineans are Assyrian/Chaldean/Syriac ($110,201, a difference of 0.090%), Italian ($110,224, a difference of 0.11%), Immigrants from Egypt ($109,941, a difference of 0.15%), Korean ($110,334, a difference of 0.21%), and Immigrants from Italy ($110,434, a difference of 0.30%).
| Demographics | Rating | Rank | Householder Income Ages 45 - 64 years |
| New Zealanders | 99.6 /100 | #66 | Exceptional $111,286 |
| Laotians | 99.5 /100 | #67 | Exceptional $111,051 |
| Immigrants | Romania | 99.4 /100 | #68 | Exceptional $110,633 |
| Immigrants | Italy | 99.4 /100 | #69 | Exceptional $110,434 |
| Koreans | 99.3 /100 | #70 | Exceptional $110,334 |
| Italians | 99.3 /100 | #71 | Exceptional $110,224 |
| Assyrians/Chaldeans/Syriacs | 99.3 /100 | #72 | Exceptional $110,201 |
| Argentineans | 99.3 /100 | #73 | Exceptional $110,103 |
| Immigrants | Egypt | 99.2 /100 | #74 | Exceptional $109,941 |
| South Africans | 99.1 /100 | #75 | Exceptional $109,719 |
| Paraguayans | 99.0 /100 | #76 | Exceptional $109,447 |
| Immigrants | England | 99.0 /100 | #77 | Exceptional $109,446 |
| Immigrants | Canada | 99.0 /100 | #78 | Exceptional $109,402 |
| Immigrants | Bulgaria | 98.9 /100 | #79 | Exceptional $109,379 |
| Jordanians | 98.9 /100 | #80 | Exceptional $109,376 |