Armenian vs Argentinean Householder Income Ages 45 - 64 years
COMPARE
Armenian
Argentinean
Householder Income Ages 45 - 64 years
Householder Income Ages 45 - 64 years Comparison
Armenians
Argentineans
$107,002
HOUSEHOLDER INCOME AGES 45 - 64 YEARS
96.6/ 100
METRIC RATING
106th/ 347
METRIC RANK
$110,103
HOUSEHOLDER INCOME AGES 45 - 64 YEARS
99.3/ 100
METRIC RATING
73rd/ 347
METRIC RANK
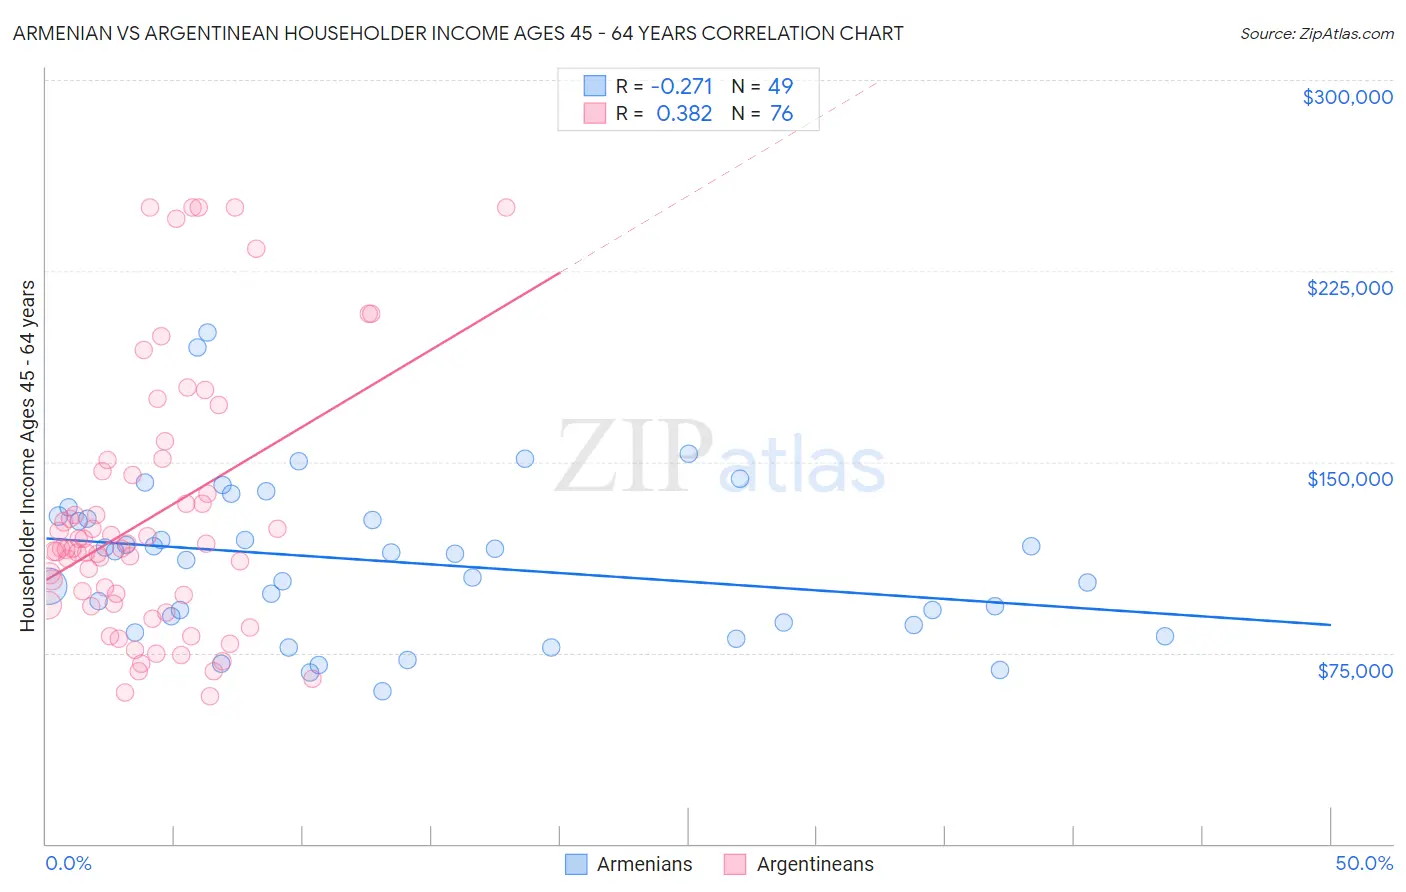
Armenian vs Argentinean Householder Income Ages 45 - 64 years Correlation Chart
The statistical analysis conducted on geographies consisting of 310,526,639 people shows a weak negative correlation between the proportion of Armenians and household income with householder between the ages 45 and 64 in the United States with a correlation coefficient (R) of -0.271 and weighted average of $107,002. Similarly, the statistical analysis conducted on geographies consisting of 296,812,150 people shows a mild positive correlation between the proportion of Argentineans and household income with householder between the ages 45 and 64 in the United States with a correlation coefficient (R) of 0.382 and weighted average of $110,103, a difference of 2.9%.
Householder Income Ages 45 - 64 years Correlation Summary
| Measurement | Armenian | Argentinean |
| Minimum | $60,000 | $57,969 |
| Maximum | $200,625 | $250,001 |
| Range | $140,625 | $192,032 |
| Mean | $110,676 | $128,288 |
| Median | $113,807 | $115,931 |
| Interquartile 25% (IQ1) | $86,427 | $94,003 |
| Interquartile 75% (IQ3) | $128,076 | $145,452 |
| Interquartile Range (IQR) | $41,649 | $51,448 |
| Standard Deviation (Sample) | $30,867 | $50,936 |
| Standard Deviation (Population) | $30,551 | $50,600 |
Similar Demographics by Householder Income Ages 45 - 64 years
Demographics Similar to Armenians by Householder Income Ages 45 - 64 years
In terms of householder income ages 45 - 64 years, the demographic groups most similar to Armenians are Immigrants from Fiji ($106,952, a difference of 0.050%), Immigrants from Ukraine ($107,079, a difference of 0.070%), Macedonian ($107,074, a difference of 0.070%), Zimbabwean ($106,849, a difference of 0.14%), and Syrian ($107,207, a difference of 0.19%).
| Demographics | Rating | Rank | Householder Income Ages 45 - 64 years |
| Palestinians | 97.6 /100 | #99 | Exceptional $107,721 |
| Immigrants | Serbia | 97.4 /100 | #100 | Exceptional $107,569 |
| Immigrants | Kazakhstan | 97.2 /100 | #101 | Exceptional $107,378 |
| Immigrants | Moldova | 97.1 /100 | #102 | Exceptional $107,357 |
| Syrians | 96.9 /100 | #103 | Exceptional $107,207 |
| Immigrants | Ukraine | 96.7 /100 | #104 | Exceptional $107,079 |
| Macedonians | 96.7 /100 | #105 | Exceptional $107,074 |
| Armenians | 96.6 /100 | #106 | Exceptional $107,002 |
| Immigrants | Fiji | 96.5 /100 | #107 | Exceptional $106,952 |
| Zimbabweans | 96.3 /100 | #108 | Exceptional $106,849 |
| Chileans | 95.9 /100 | #109 | Exceptional $106,611 |
| Immigrants | Brazil | 95.6 /100 | #110 | Exceptional $106,470 |
| Immigrants | Vietnam | 95.5 /100 | #111 | Exceptional $106,417 |
| Swedes | 95.4 /100 | #112 | Exceptional $106,377 |
| Europeans | 95.4 /100 | #113 | Exceptional $106,367 |
Demographics Similar to Argentineans by Householder Income Ages 45 - 64 years
In terms of householder income ages 45 - 64 years, the demographic groups most similar to Argentineans are Assyrian/Chaldean/Syriac ($110,201, a difference of 0.090%), Italian ($110,224, a difference of 0.11%), Immigrants from Egypt ($109,941, a difference of 0.15%), Korean ($110,334, a difference of 0.21%), and Immigrants from Italy ($110,434, a difference of 0.30%).
| Demographics | Rating | Rank | Householder Income Ages 45 - 64 years |
| New Zealanders | 99.6 /100 | #66 | Exceptional $111,286 |
| Laotians | 99.5 /100 | #67 | Exceptional $111,051 |
| Immigrants | Romania | 99.4 /100 | #68 | Exceptional $110,633 |
| Immigrants | Italy | 99.4 /100 | #69 | Exceptional $110,434 |
| Koreans | 99.3 /100 | #70 | Exceptional $110,334 |
| Italians | 99.3 /100 | #71 | Exceptional $110,224 |
| Assyrians/Chaldeans/Syriacs | 99.3 /100 | #72 | Exceptional $110,201 |
| Argentineans | 99.3 /100 | #73 | Exceptional $110,103 |
| Immigrants | Egypt | 99.2 /100 | #74 | Exceptional $109,941 |
| South Africans | 99.1 /100 | #75 | Exceptional $109,719 |
| Paraguayans | 99.0 /100 | #76 | Exceptional $109,447 |
| Immigrants | England | 99.0 /100 | #77 | Exceptional $109,446 |
| Immigrants | Canada | 99.0 /100 | #78 | Exceptional $109,402 |
| Immigrants | Bulgaria | 98.9 /100 | #79 | Exceptional $109,379 |
| Jordanians | 98.9 /100 | #80 | Exceptional $109,376 |