Immigrants from Northern Europe vs Argentinean Householder Income Ages 45 - 64 years
COMPARE
Immigrants from Northern Europe
Argentinean
Householder Income Ages 45 - 64 years
Householder Income Ages 45 - 64 years Comparison
Immigrants from Northern Europe
Argentineans
$117,930
HOUSEHOLDER INCOME AGES 45 - 64 YEARS
100.0/ 100
METRIC RATING
27th/ 347
METRIC RANK
$110,103
HOUSEHOLDER INCOME AGES 45 - 64 YEARS
99.3/ 100
METRIC RATING
73rd/ 347
METRIC RANK
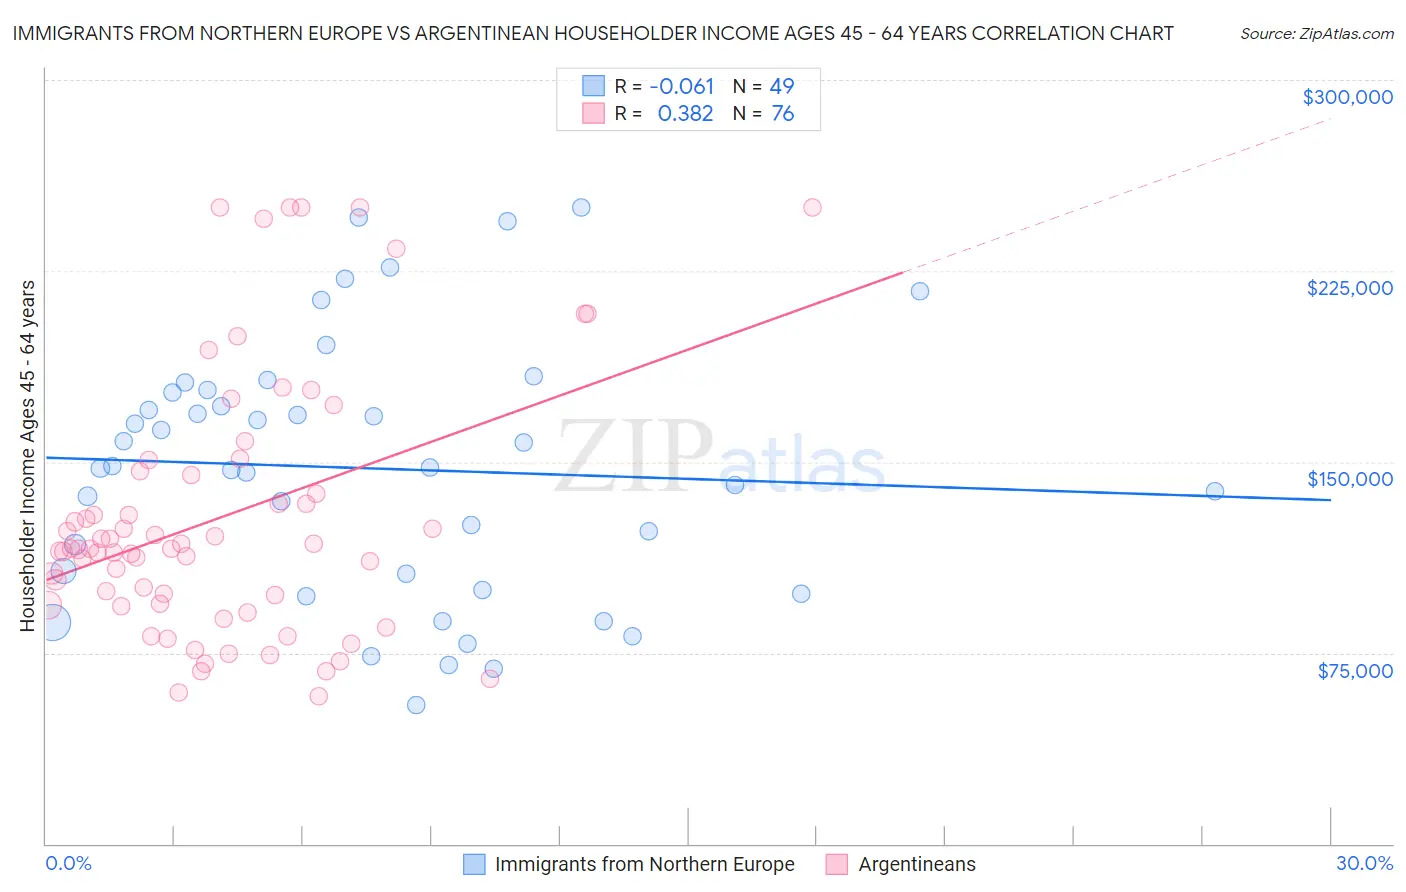
Immigrants from Northern Europe vs Argentinean Householder Income Ages 45 - 64 years Correlation Chart
The statistical analysis conducted on geographies consisting of 476,061,115 people shows a slight negative correlation between the proportion of Immigrants from Northern Europe and household income with householder between the ages 45 and 64 in the United States with a correlation coefficient (R) of -0.061 and weighted average of $117,930. Similarly, the statistical analysis conducted on geographies consisting of 296,812,150 people shows a mild positive correlation between the proportion of Argentineans and household income with householder between the ages 45 and 64 in the United States with a correlation coefficient (R) of 0.382 and weighted average of $110,103, a difference of 7.1%.
Householder Income Ages 45 - 64 years Correlation Summary
| Measurement | Immigrants from Northern Europe | Argentinean |
| Minimum | $54,375 | $57,969 |
| Maximum | $250,001 | $250,001 |
| Range | $195,626 | $192,032 |
| Mean | $147,439 | $128,288 |
| Median | $147,652 | $115,931 |
| Interquartile 25% (IQ1) | $102,957 | $94,003 |
| Interquartile 75% (IQ3) | $177,734 | $145,452 |
| Interquartile Range (IQR) | $74,777 | $51,448 |
| Standard Deviation (Sample) | $50,256 | $50,936 |
| Standard Deviation (Population) | $49,741 | $50,600 |
Similar Demographics by Householder Income Ages 45 - 64 years
Demographics Similar to Immigrants from Northern Europe by Householder Income Ages 45 - 64 years
In terms of householder income ages 45 - 64 years, the demographic groups most similar to Immigrants from Northern Europe are Turkish ($117,814, a difference of 0.10%), Bhutanese ($117,750, a difference of 0.15%), Immigrants from Bolivia ($117,731, a difference of 0.17%), Immigrants from Sweden ($118,318, a difference of 0.33%), and Asian ($118,426, a difference of 0.42%).
| Demographics | Rating | Rank | Householder Income Ages 45 - 64 years |
| Immigrants | Australia | 100.0 /100 | #20 | Exceptional $119,308 |
| Immigrants | Sri Lanka | 100.0 /100 | #21 | Exceptional $119,094 |
| Immigrants | Belgium | 100.0 /100 | #22 | Exceptional $118,932 |
| Bolivians | 100.0 /100 | #23 | Exceptional $118,871 |
| Immigrants | Japan | 100.0 /100 | #24 | Exceptional $118,498 |
| Asians | 100.0 /100 | #25 | Exceptional $118,426 |
| Immigrants | Sweden | 100.0 /100 | #26 | Exceptional $118,318 |
| Immigrants | Northern Europe | 100.0 /100 | #27 | Exceptional $117,930 |
| Turks | 100.0 /100 | #28 | Exceptional $117,814 |
| Bhutanese | 100.0 /100 | #29 | Exceptional $117,750 |
| Immigrants | Bolivia | 100.0 /100 | #30 | Exceptional $117,731 |
| Immigrants | Asia | 100.0 /100 | #31 | Exceptional $116,566 |
| Russians | 100.0 /100 | #32 | Exceptional $116,328 |
| Chinese | 100.0 /100 | #33 | Exceptional $116,156 |
| Immigrants | Denmark | 100.0 /100 | #34 | Exceptional $116,000 |
Demographics Similar to Argentineans by Householder Income Ages 45 - 64 years
In terms of householder income ages 45 - 64 years, the demographic groups most similar to Argentineans are Assyrian/Chaldean/Syriac ($110,201, a difference of 0.090%), Italian ($110,224, a difference of 0.11%), Immigrants from Egypt ($109,941, a difference of 0.15%), Korean ($110,334, a difference of 0.21%), and Immigrants from Italy ($110,434, a difference of 0.30%).
| Demographics | Rating | Rank | Householder Income Ages 45 - 64 years |
| New Zealanders | 99.6 /100 | #66 | Exceptional $111,286 |
| Laotians | 99.5 /100 | #67 | Exceptional $111,051 |
| Immigrants | Romania | 99.4 /100 | #68 | Exceptional $110,633 |
| Immigrants | Italy | 99.4 /100 | #69 | Exceptional $110,434 |
| Koreans | 99.3 /100 | #70 | Exceptional $110,334 |
| Italians | 99.3 /100 | #71 | Exceptional $110,224 |
| Assyrians/Chaldeans/Syriacs | 99.3 /100 | #72 | Exceptional $110,201 |
| Argentineans | 99.3 /100 | #73 | Exceptional $110,103 |
| Immigrants | Egypt | 99.2 /100 | #74 | Exceptional $109,941 |
| South Africans | 99.1 /100 | #75 | Exceptional $109,719 |
| Paraguayans | 99.0 /100 | #76 | Exceptional $109,447 |
| Immigrants | England | 99.0 /100 | #77 | Exceptional $109,446 |
| Immigrants | Canada | 99.0 /100 | #78 | Exceptional $109,402 |
| Immigrants | Bulgaria | 98.9 /100 | #79 | Exceptional $109,379 |
| Jordanians | 98.9 /100 | #80 | Exceptional $109,376 |