Immigrants from Uruguay vs Argentinean Householder Income Ages 45 - 64 years
COMPARE
Immigrants from Uruguay
Argentinean
Householder Income Ages 45 - 64 years
Householder Income Ages 45 - 64 years Comparison
Immigrants from Uruguay
Argentineans
$96,086
HOUSEHOLDER INCOME AGES 45 - 64 YEARS
10.7/ 100
METRIC RATING
213th/ 347
METRIC RANK
$110,103
HOUSEHOLDER INCOME AGES 45 - 64 YEARS
99.3/ 100
METRIC RATING
73rd/ 347
METRIC RANK
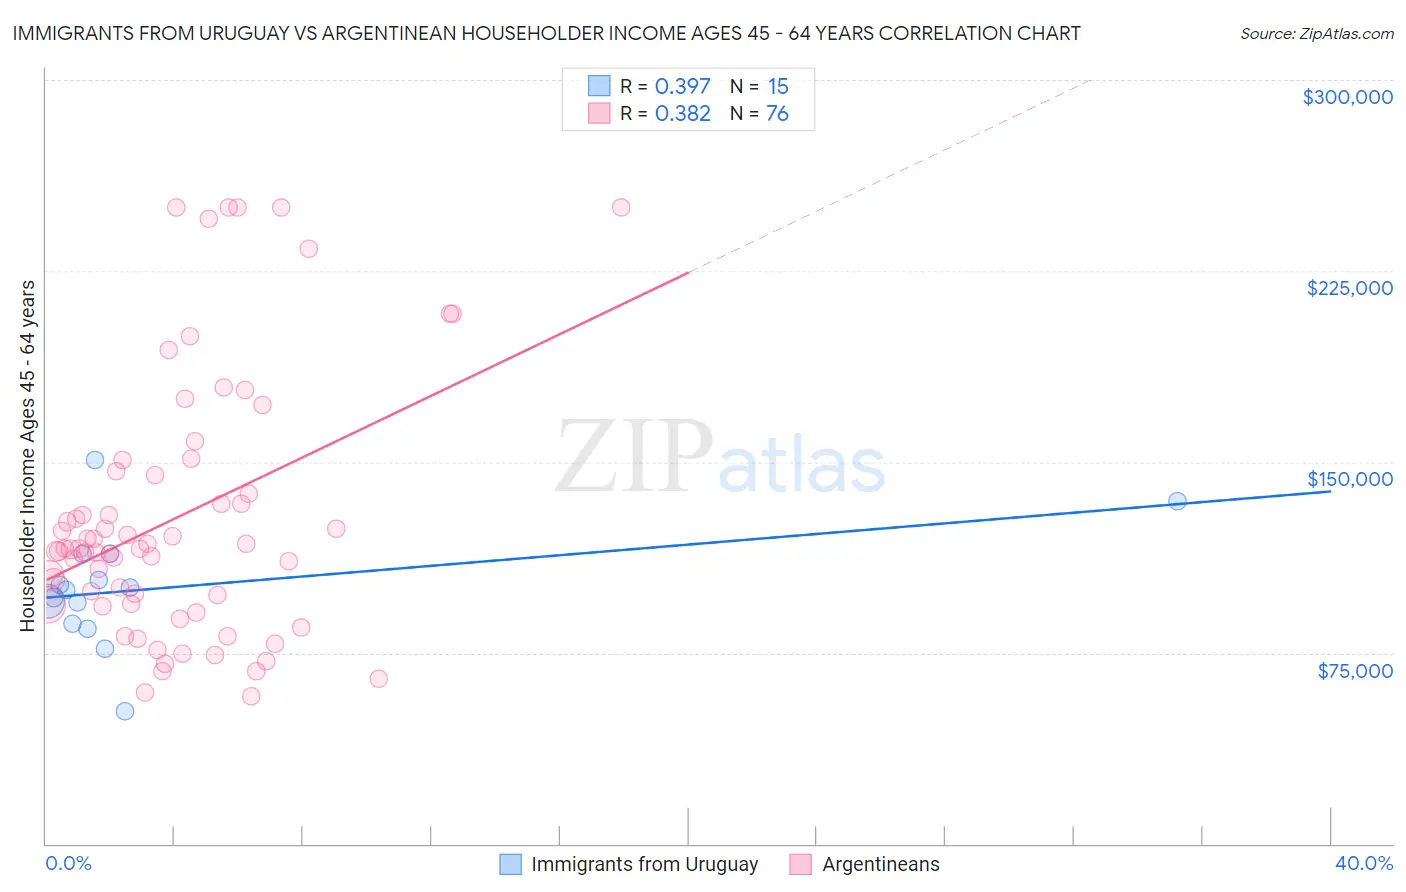
Immigrants from Uruguay vs Argentinean Householder Income Ages 45 - 64 years Correlation Chart
The statistical analysis conducted on geographies consisting of 133,207,341 people shows a mild positive correlation between the proportion of Immigrants from Uruguay and household income with householder between the ages 45 and 64 in the United States with a correlation coefficient (R) of 0.397 and weighted average of $96,086. Similarly, the statistical analysis conducted on geographies consisting of 296,812,150 people shows a mild positive correlation between the proportion of Argentineans and household income with householder between the ages 45 and 64 in the United States with a correlation coefficient (R) of 0.382 and weighted average of $110,103, a difference of 14.6%.
Householder Income Ages 45 - 64 years Correlation Summary
| Measurement | Immigrants from Uruguay | Argentinean |
| Minimum | $51,929 | $57,969 |
| Maximum | $150,685 | $250,001 |
| Range | $98,756 | $192,032 |
| Mean | $100,358 | $128,288 |
| Median | $99,578 | $115,931 |
| Interquartile 25% (IQ1) | $86,473 | $94,003 |
| Interquartile 75% (IQ3) | $113,852 | $145,452 |
| Interquartile Range (IQR) | $27,380 | $51,448 |
| Standard Deviation (Sample) | $23,140 | $50,936 |
| Standard Deviation (Population) | $22,356 | $50,600 |
Similar Demographics by Householder Income Ages 45 - 64 years
Demographics Similar to Immigrants from Uruguay by Householder Income Ages 45 - 64 years
In terms of householder income ages 45 - 64 years, the demographic groups most similar to Immigrants from Uruguay are Panamanian ($96,066, a difference of 0.020%), Venezuelan ($96,460, a difference of 0.39%), Immigrants from Cambodia ($96,537, a difference of 0.47%), Nigerian ($95,492, a difference of 0.62%), and Tsimshian ($96,783, a difference of 0.73%).
| Demographics | Rating | Rank | Householder Income Ages 45 - 64 years |
| Immigrants | Africa | 17.9 /100 | #206 | Poor $97,284 |
| Ghanaians | 17.9 /100 | #207 | Poor $97,277 |
| Scotch-Irish | 16.4 /100 | #208 | Poor $97,073 |
| Japanese | 14.8 /100 | #209 | Poor $96,834 |
| Tsimshian | 14.5 /100 | #210 | Poor $96,783 |
| Immigrants | Cambodia | 13.0 /100 | #211 | Poor $96,537 |
| Venezuelans | 12.6 /100 | #212 | Poor $96,460 |
| Immigrants | Uruguay | 10.7 /100 | #213 | Poor $96,086 |
| Panamanians | 10.6 /100 | #214 | Poor $96,066 |
| Nigerians | 8.2 /100 | #215 | Tragic $95,492 |
| Immigrants | Venezuela | 7.6 /100 | #216 | Tragic $95,342 |
| Immigrants | Ghana | 6.4 /100 | #217 | Tragic $94,982 |
| Delaware | 6.2 /100 | #218 | Tragic $94,914 |
| Immigrants | Armenia | 6.1 /100 | #219 | Tragic $94,863 |
| Salvadorans | 6.0 /100 | #220 | Tragic $94,842 |
Demographics Similar to Argentineans by Householder Income Ages 45 - 64 years
In terms of householder income ages 45 - 64 years, the demographic groups most similar to Argentineans are Assyrian/Chaldean/Syriac ($110,201, a difference of 0.090%), Italian ($110,224, a difference of 0.11%), Immigrants from Egypt ($109,941, a difference of 0.15%), Korean ($110,334, a difference of 0.21%), and Immigrants from Italy ($110,434, a difference of 0.30%).
| Demographics | Rating | Rank | Householder Income Ages 45 - 64 years |
| New Zealanders | 99.6 /100 | #66 | Exceptional $111,286 |
| Laotians | 99.5 /100 | #67 | Exceptional $111,051 |
| Immigrants | Romania | 99.4 /100 | #68 | Exceptional $110,633 |
| Immigrants | Italy | 99.4 /100 | #69 | Exceptional $110,434 |
| Koreans | 99.3 /100 | #70 | Exceptional $110,334 |
| Italians | 99.3 /100 | #71 | Exceptional $110,224 |
| Assyrians/Chaldeans/Syriacs | 99.3 /100 | #72 | Exceptional $110,201 |
| Argentineans | 99.3 /100 | #73 | Exceptional $110,103 |
| Immigrants | Egypt | 99.2 /100 | #74 | Exceptional $109,941 |
| South Africans | 99.1 /100 | #75 | Exceptional $109,719 |
| Paraguayans | 99.0 /100 | #76 | Exceptional $109,447 |
| Immigrants | England | 99.0 /100 | #77 | Exceptional $109,446 |
| Immigrants | Canada | 99.0 /100 | #78 | Exceptional $109,402 |
| Immigrants | Bulgaria | 98.9 /100 | #79 | Exceptional $109,379 |
| Jordanians | 98.9 /100 | #80 | Exceptional $109,376 |