Yakama vs Argentinean Householder Income Ages 45 - 64 years
COMPARE
Yakama
Argentinean
Householder Income Ages 45 - 64 years
Householder Income Ages 45 - 64 years Comparison
Yakama
Argentineans
$86,992
HOUSEHOLDER INCOME AGES 45 - 64 YEARS
0.1/ 100
METRIC RATING
279th/ 347
METRIC RANK
$110,103
HOUSEHOLDER INCOME AGES 45 - 64 YEARS
99.3/ 100
METRIC RATING
73rd/ 347
METRIC RANK
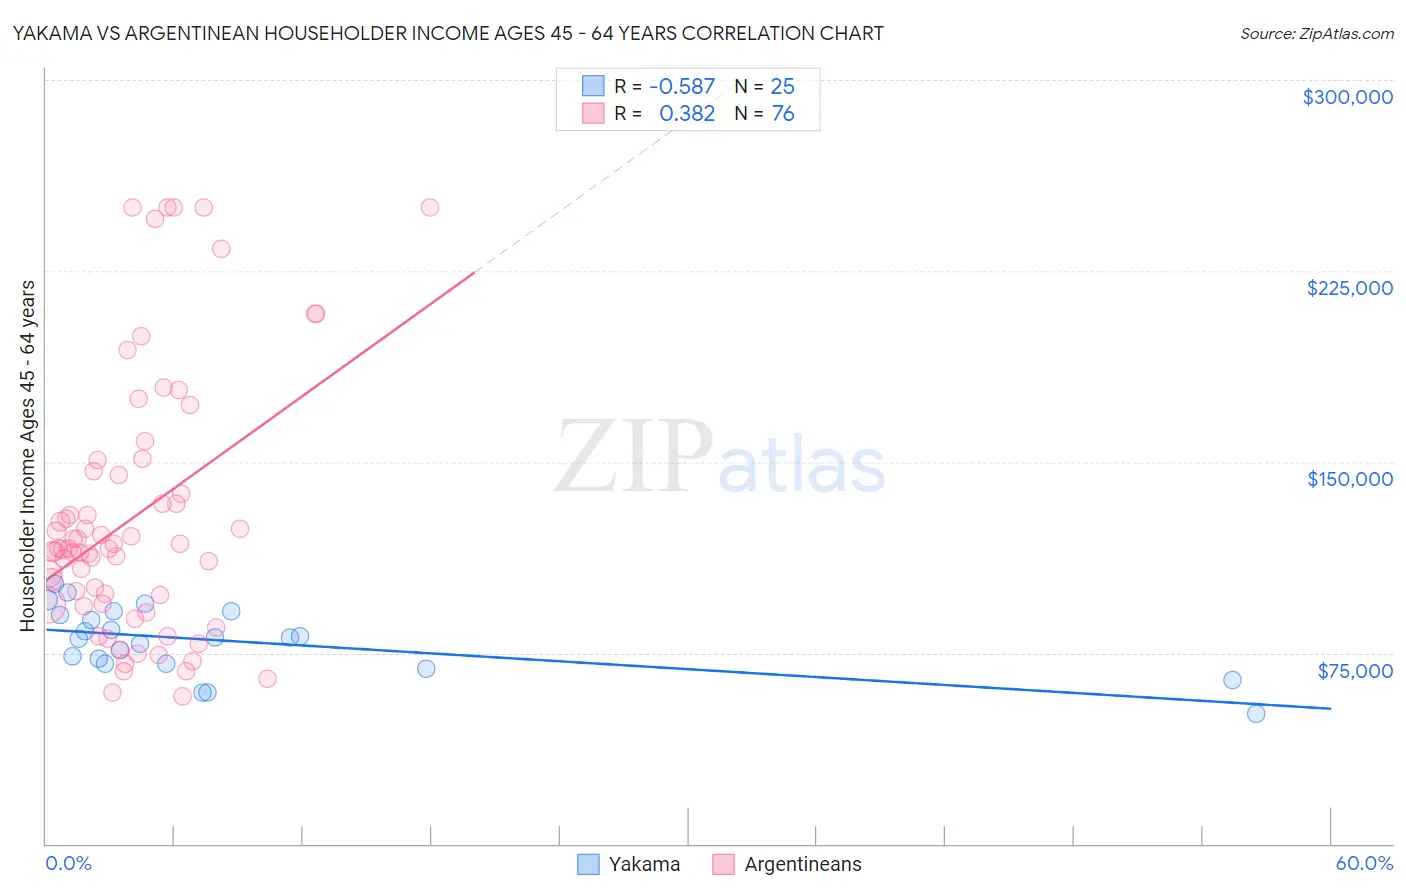
Yakama vs Argentinean Householder Income Ages 45 - 64 years Correlation Chart
The statistical analysis conducted on geographies consisting of 19,897,154 people shows a substantial negative correlation between the proportion of Yakama and household income with householder between the ages 45 and 64 in the United States with a correlation coefficient (R) of -0.587 and weighted average of $86,992. Similarly, the statistical analysis conducted on geographies consisting of 296,812,150 people shows a mild positive correlation between the proportion of Argentineans and household income with householder between the ages 45 and 64 in the United States with a correlation coefficient (R) of 0.382 and weighted average of $110,103, a difference of 26.6%.
Householder Income Ages 45 - 64 years Correlation Summary
| Measurement | Yakama | Argentinean |
| Minimum | $51,250 | $57,969 |
| Maximum | $102,065 | $250,001 |
| Range | $50,815 | $192,032 |
| Mean | $79,495 | $128,288 |
| Median | $80,929 | $115,931 |
| Interquartile 25% (IQ1) | $70,556 | $94,003 |
| Interquartile 75% (IQ3) | $90,396 | $145,452 |
| Interquartile Range (IQR) | $19,840 | $51,448 |
| Standard Deviation (Sample) | $13,031 | $50,936 |
| Standard Deviation (Population) | $12,768 | $50,600 |
Similar Demographics by Householder Income Ages 45 - 64 years
Demographics Similar to Yakama by Householder Income Ages 45 - 64 years
In terms of householder income ages 45 - 64 years, the demographic groups most similar to Yakama are Immigrants from Somalia ($86,987, a difference of 0.010%), Immigrants from Jamaica ($87,035, a difference of 0.050%), Yaqui ($86,914, a difference of 0.090%), Senegalese ($86,897, a difference of 0.11%), and Mexican ($86,816, a difference of 0.20%).
| Demographics | Rating | Rank | Householder Income Ages 45 - 64 years |
| Cape Verdeans | 0.2 /100 | #272 | Tragic $87,580 |
| Spanish American Indians | 0.2 /100 | #273 | Tragic $87,561 |
| Iroquois | 0.1 /100 | #274 | Tragic $87,255 |
| Immigrants | Belize | 0.1 /100 | #275 | Tragic $87,229 |
| Immigrants | Latin America | 0.1 /100 | #276 | Tragic $87,219 |
| Cree | 0.1 /100 | #277 | Tragic $87,185 |
| Immigrants | Jamaica | 0.1 /100 | #278 | Tragic $87,035 |
| Yakama | 0.1 /100 | #279 | Tragic $86,992 |
| Immigrants | Somalia | 0.1 /100 | #280 | Tragic $86,987 |
| Yaqui | 0.1 /100 | #281 | Tragic $86,914 |
| Senegalese | 0.1 /100 | #282 | Tragic $86,897 |
| Mexicans | 0.1 /100 | #283 | Tragic $86,816 |
| Central American Indians | 0.1 /100 | #284 | Tragic $86,764 |
| Blackfeet | 0.1 /100 | #285 | Tragic $86,595 |
| Immigrants | Guatemala | 0.1 /100 | #286 | Tragic $86,573 |
Demographics Similar to Argentineans by Householder Income Ages 45 - 64 years
In terms of householder income ages 45 - 64 years, the demographic groups most similar to Argentineans are Assyrian/Chaldean/Syriac ($110,201, a difference of 0.090%), Italian ($110,224, a difference of 0.11%), Immigrants from Egypt ($109,941, a difference of 0.15%), Korean ($110,334, a difference of 0.21%), and Immigrants from Italy ($110,434, a difference of 0.30%).
| Demographics | Rating | Rank | Householder Income Ages 45 - 64 years |
| New Zealanders | 99.6 /100 | #66 | Exceptional $111,286 |
| Laotians | 99.5 /100 | #67 | Exceptional $111,051 |
| Immigrants | Romania | 99.4 /100 | #68 | Exceptional $110,633 |
| Immigrants | Italy | 99.4 /100 | #69 | Exceptional $110,434 |
| Koreans | 99.3 /100 | #70 | Exceptional $110,334 |
| Italians | 99.3 /100 | #71 | Exceptional $110,224 |
| Assyrians/Chaldeans/Syriacs | 99.3 /100 | #72 | Exceptional $110,201 |
| Argentineans | 99.3 /100 | #73 | Exceptional $110,103 |
| Immigrants | Egypt | 99.2 /100 | #74 | Exceptional $109,941 |
| South Africans | 99.1 /100 | #75 | Exceptional $109,719 |
| Paraguayans | 99.0 /100 | #76 | Exceptional $109,447 |
| Immigrants | England | 99.0 /100 | #77 | Exceptional $109,446 |
| Immigrants | Canada | 99.0 /100 | #78 | Exceptional $109,402 |
| Immigrants | Bulgaria | 98.9 /100 | #79 | Exceptional $109,379 |
| Jordanians | 98.9 /100 | #80 | Exceptional $109,376 |