Uruguayan vs Immigrants from St. Vincent and the Grenadines Median Earnings
COMPARE
Uruguayan
Immigrants from St. Vincent and the Grenadines
Median Earnings
Median Earnings Comparison
Uruguayans
Immigrants from St. Vincent and the Grenadines
$46,190
MEDIAN EARNINGS
41.6/ 100
METRIC RATING
185th/ 347
METRIC RANK
$45,908
MEDIAN EARNINGS
32.4/ 100
METRIC RATING
195th/ 347
METRIC RANK
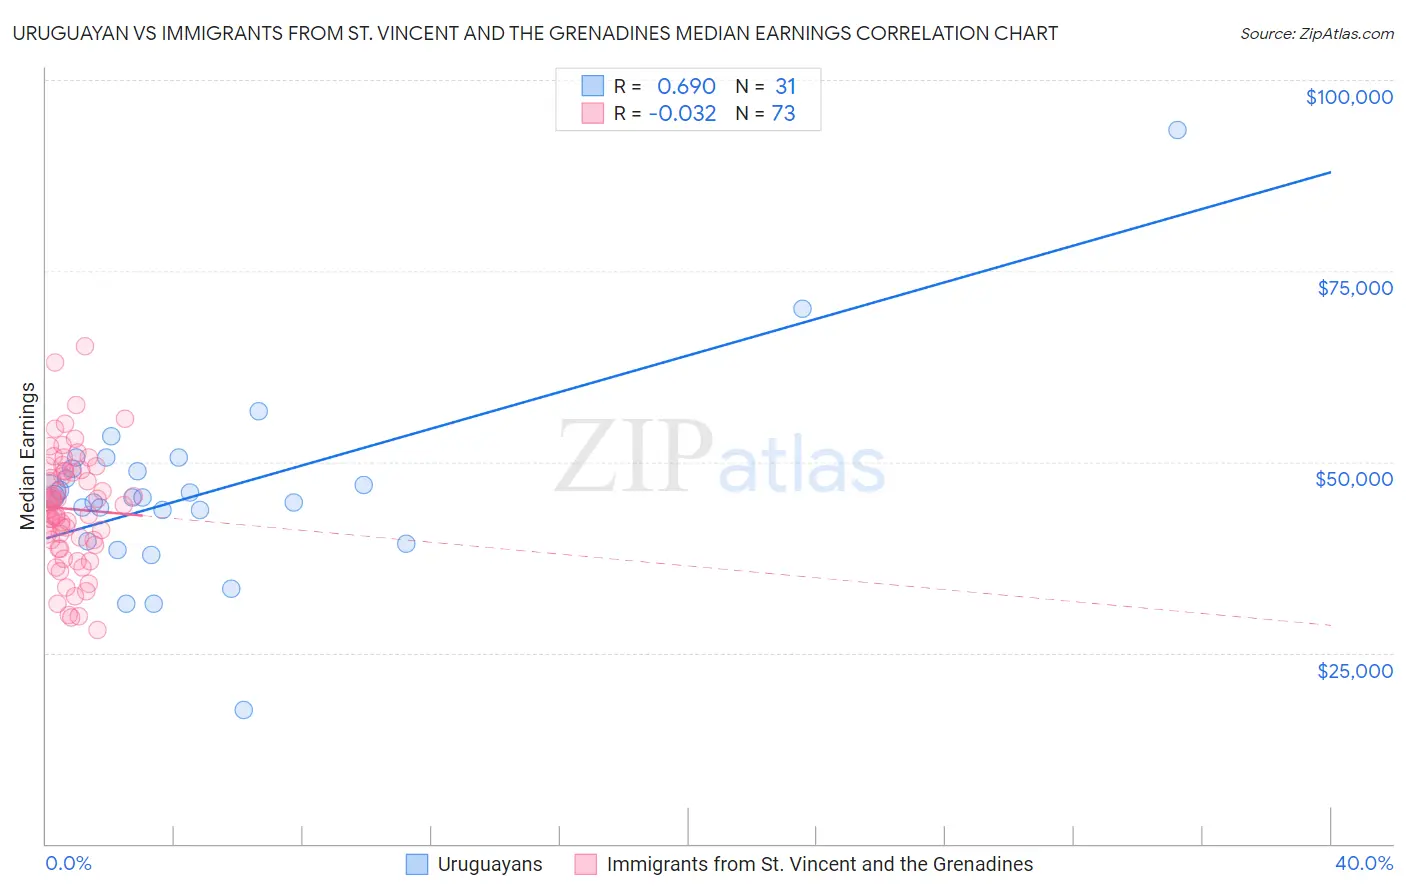
Uruguayan vs Immigrants from St. Vincent and the Grenadines Median Earnings Correlation Chart
The statistical analysis conducted on geographies consisting of 144,784,894 people shows a significant positive correlation between the proportion of Uruguayans and median earnings in the United States with a correlation coefficient (R) of 0.690 and weighted average of $46,190. Similarly, the statistical analysis conducted on geographies consisting of 56,194,678 people shows no correlation between the proportion of Immigrants from St. Vincent and the Grenadines and median earnings in the United States with a correlation coefficient (R) of -0.032 and weighted average of $45,908, a difference of 0.62%.
Median Earnings Correlation Summary
| Measurement | Uruguayan | Immigrants from St. Vincent and the Grenadines |
| Minimum | $17,500 | $27,951 |
| Maximum | $93,387 | $65,069 |
| Range | $75,887 | $37,118 |
| Mean | $45,994 | $43,851 |
| Median | $45,417 | $43,770 |
| Interquartile 25% (IQ1) | $39,561 | $39,492 |
| Interquartile 75% (IQ3) | $49,175 | $48,733 |
| Interquartile Range (IQR) | $9,613 | $9,241 |
| Standard Deviation (Sample) | $12,526 | $7,478 |
| Standard Deviation (Population) | $12,322 | $7,427 |
Demographics Similar to Uruguayans and Immigrants from St. Vincent and the Grenadines by Median Earnings
In terms of median earnings, the demographic groups most similar to Uruguayans are Vietnamese ($46,172, a difference of 0.040%), Immigrants from Kenya ($46,214, a difference of 0.050%), Iraqi ($46,140, a difference of 0.11%), Immigrants from Armenia ($46,094, a difference of 0.21%), and French ($46,296, a difference of 0.23%). Similarly, the demographic groups most similar to Immigrants from St. Vincent and the Grenadines are Immigrants from Costa Rica ($45,928, a difference of 0.040%), German ($45,935, a difference of 0.060%), Guamanian/Chamorro ($45,933, a difference of 0.060%), Finnish ($45,940, a difference of 0.070%), and Yugoslavian ($45,846, a difference of 0.13%).
| Demographics | Rating | Rank | Median Earnings |
| Puget Sound Salish | 46.5 /100 | #180 | Average $46,333 |
| Immigrants | Cameroon | 46.4 /100 | #181 | Average $46,329 |
| Swiss | 45.9 /100 | #182 | Average $46,315 |
| French | 45.2 /100 | #183 | Average $46,296 |
| Immigrants | Kenya | 42.4 /100 | #184 | Average $46,214 |
| Uruguayans | 41.6 /100 | #185 | Average $46,190 |
| Vietnamese | 40.9 /100 | #186 | Average $46,172 |
| Iraqis | 39.9 /100 | #187 | Fair $46,140 |
| Immigrants | Armenia | 38.3 /100 | #188 | Fair $46,094 |
| Spaniards | 37.2 /100 | #189 | Fair $46,059 |
| French Canadians | 36.1 /100 | #190 | Fair $46,026 |
| Finns | 33.4 /100 | #191 | Fair $45,940 |
| Germans | 33.2 /100 | #192 | Fair $45,935 |
| Guamanians/Chamorros | 33.2 /100 | #193 | Fair $45,933 |
| Immigrants | Costa Rica | 33.0 /100 | #194 | Fair $45,928 |
| Immigrants | St. Vincent and the Grenadines | 32.4 /100 | #195 | Fair $45,908 |
| Yugoslavians | 30.5 /100 | #196 | Fair $45,846 |
| Barbadians | 30.5 /100 | #197 | Fair $45,846 |
| Trinidadians and Tobagonians | 29.7 /100 | #198 | Fair $45,820 |
| Immigrants | Barbados | 29.6 /100 | #199 | Fair $45,816 |
| Immigrants | Azores | 29.5 /100 | #200 | Fair $45,812 |