Uruguayan vs Laotian Median Earnings
COMPARE
Uruguayan
Laotian
Median Earnings
Median Earnings Comparison
Uruguayans
Laotians
$46,190
MEDIAN EARNINGS
41.6/ 100
METRIC RATING
185th/ 347
METRIC RANK
$50,343
MEDIAN EARNINGS
99.6/ 100
METRIC RATING
79th/ 347
METRIC RANK
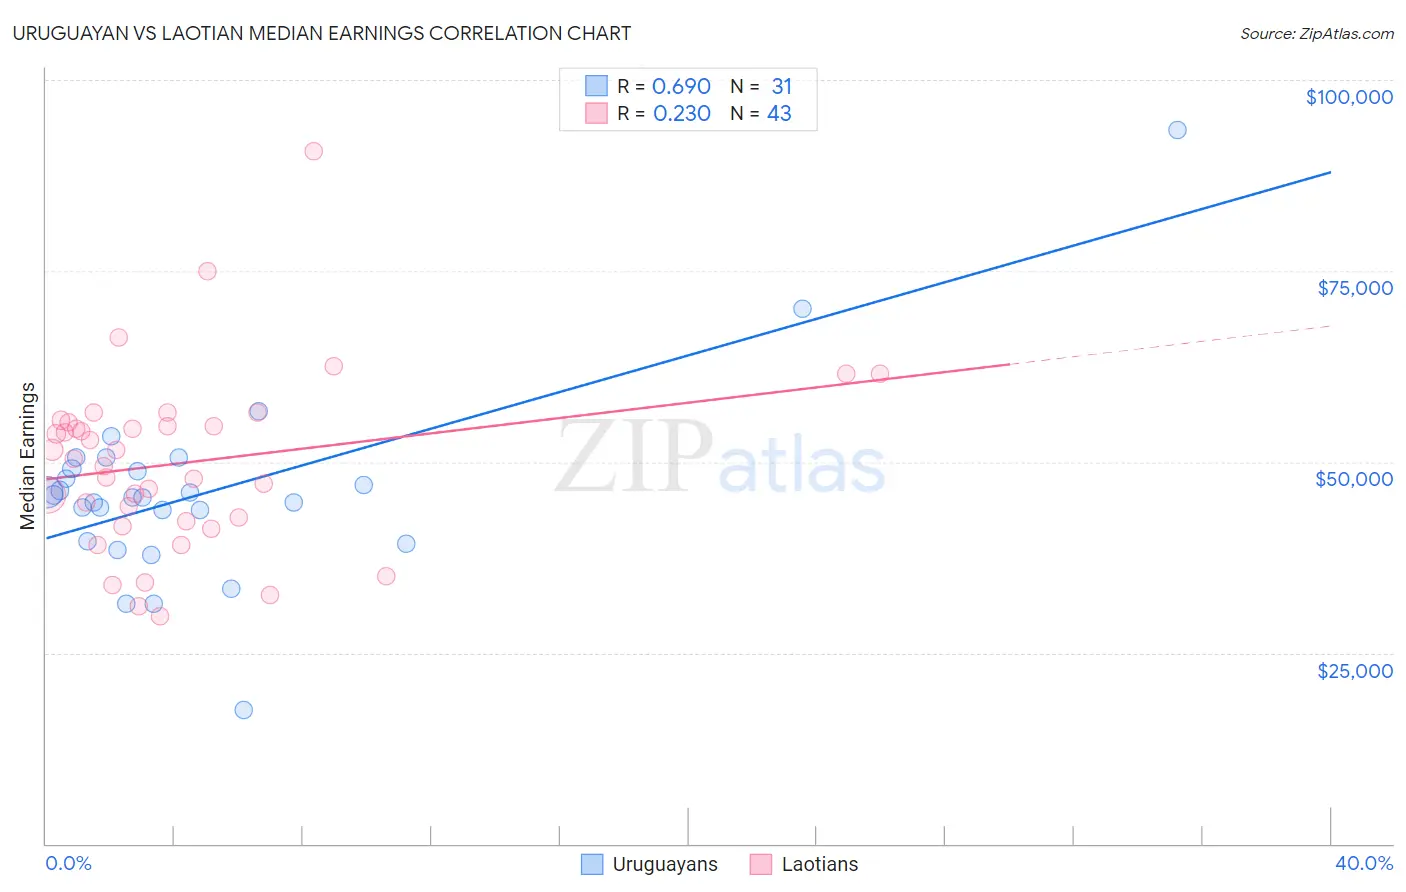
Uruguayan vs Laotian Median Earnings Correlation Chart
The statistical analysis conducted on geographies consisting of 144,784,894 people shows a significant positive correlation between the proportion of Uruguayans and median earnings in the United States with a correlation coefficient (R) of 0.690 and weighted average of $46,190. Similarly, the statistical analysis conducted on geographies consisting of 224,848,117 people shows a weak positive correlation between the proportion of Laotians and median earnings in the United States with a correlation coefficient (R) of 0.230 and weighted average of $50,343, a difference of 9.0%.
Median Earnings Correlation Summary
| Measurement | Uruguayan | Laotian |
| Minimum | $17,500 | $29,751 |
| Maximum | $93,387 | $90,729 |
| Range | $75,887 | $60,978 |
| Mean | $45,994 | $49,880 |
| Median | $45,417 | $50,359 |
| Interquartile 25% (IQ1) | $39,561 | $42,206 |
| Interquartile 75% (IQ3) | $49,175 | $55,106 |
| Interquartile Range (IQR) | $9,613 | $12,900 |
| Standard Deviation (Sample) | $12,526 | $11,670 |
| Standard Deviation (Population) | $12,322 | $11,533 |
Similar Demographics by Median Earnings
Demographics Similar to Uruguayans by Median Earnings
In terms of median earnings, the demographic groups most similar to Uruguayans are Vietnamese ($46,172, a difference of 0.040%), Immigrants from Kenya ($46,214, a difference of 0.050%), Iraqi ($46,140, a difference of 0.11%), Immigrants from Armenia ($46,094, a difference of 0.21%), and French ($46,296, a difference of 0.23%).
| Demographics | Rating | Rank | Median Earnings |
| Colombians | 47.1 /100 | #178 | Average $46,349 |
| English | 46.5 /100 | #179 | Average $46,334 |
| Puget Sound Salish | 46.5 /100 | #180 | Average $46,333 |
| Immigrants | Cameroon | 46.4 /100 | #181 | Average $46,329 |
| Swiss | 45.9 /100 | #182 | Average $46,315 |
| French | 45.2 /100 | #183 | Average $46,296 |
| Immigrants | Kenya | 42.4 /100 | #184 | Average $46,214 |
| Uruguayans | 41.6 /100 | #185 | Average $46,190 |
| Vietnamese | 40.9 /100 | #186 | Average $46,172 |
| Iraqis | 39.9 /100 | #187 | Fair $46,140 |
| Immigrants | Armenia | 38.3 /100 | #188 | Fair $46,094 |
| Spaniards | 37.2 /100 | #189 | Fair $46,059 |
| French Canadians | 36.1 /100 | #190 | Fair $46,026 |
| Finns | 33.4 /100 | #191 | Fair $45,940 |
| Germans | 33.2 /100 | #192 | Fair $45,935 |
Demographics Similar to Laotians by Median Earnings
In terms of median earnings, the demographic groups most similar to Laotians are Ukrainian ($50,320, a difference of 0.050%), Argentinean ($50,399, a difference of 0.11%), Immigrants from Southern Europe ($50,280, a difference of 0.12%), Immigrants from Moldova ($50,274, a difference of 0.14%), and Romanian ($50,244, a difference of 0.20%).
| Demographics | Rating | Rank | Median Earnings |
| Immigrants | Egypt | 99.8 /100 | #72 | Exceptional $50,901 |
| Immigrants | Netherlands | 99.8 /100 | #73 | Exceptional $50,818 |
| South Africans | 99.8 /100 | #74 | Exceptional $50,752 |
| Immigrants | Scotland | 99.8 /100 | #75 | Exceptional $50,741 |
| Immigrants | Italy | 99.7 /100 | #76 | Exceptional $50,581 |
| Immigrants | Western Europe | 99.7 /100 | #77 | Exceptional $50,549 |
| Argentineans | 99.6 /100 | #78 | Exceptional $50,399 |
| Laotians | 99.6 /100 | #79 | Exceptional $50,343 |
| Ukrainians | 99.6 /100 | #80 | Exceptional $50,320 |
| Immigrants | Southern Europe | 99.6 /100 | #81 | Exceptional $50,280 |
| Immigrants | Moldova | 99.5 /100 | #82 | Exceptional $50,274 |
| Romanians | 99.5 /100 | #83 | Exceptional $50,244 |
| Immigrants | Hungary | 99.5 /100 | #84 | Exceptional $50,227 |
| Immigrants | Kazakhstan | 99.5 /100 | #85 | Exceptional $50,225 |
| Immigrants | Canada | 99.5 /100 | #86 | Exceptional $50,192 |