Ugandan vs Colombian Per Capita Income
COMPARE
Ugandan
Colombian
Per Capita Income
Per Capita Income Comparison
Ugandans
Colombians
$45,047
PER CAPITA INCOME
82.6/ 100
METRIC RATING
142nd/ 347
METRIC RANK
$43,661
PER CAPITA INCOME
50.0/ 100
METRIC RATING
174th/ 347
METRIC RANK
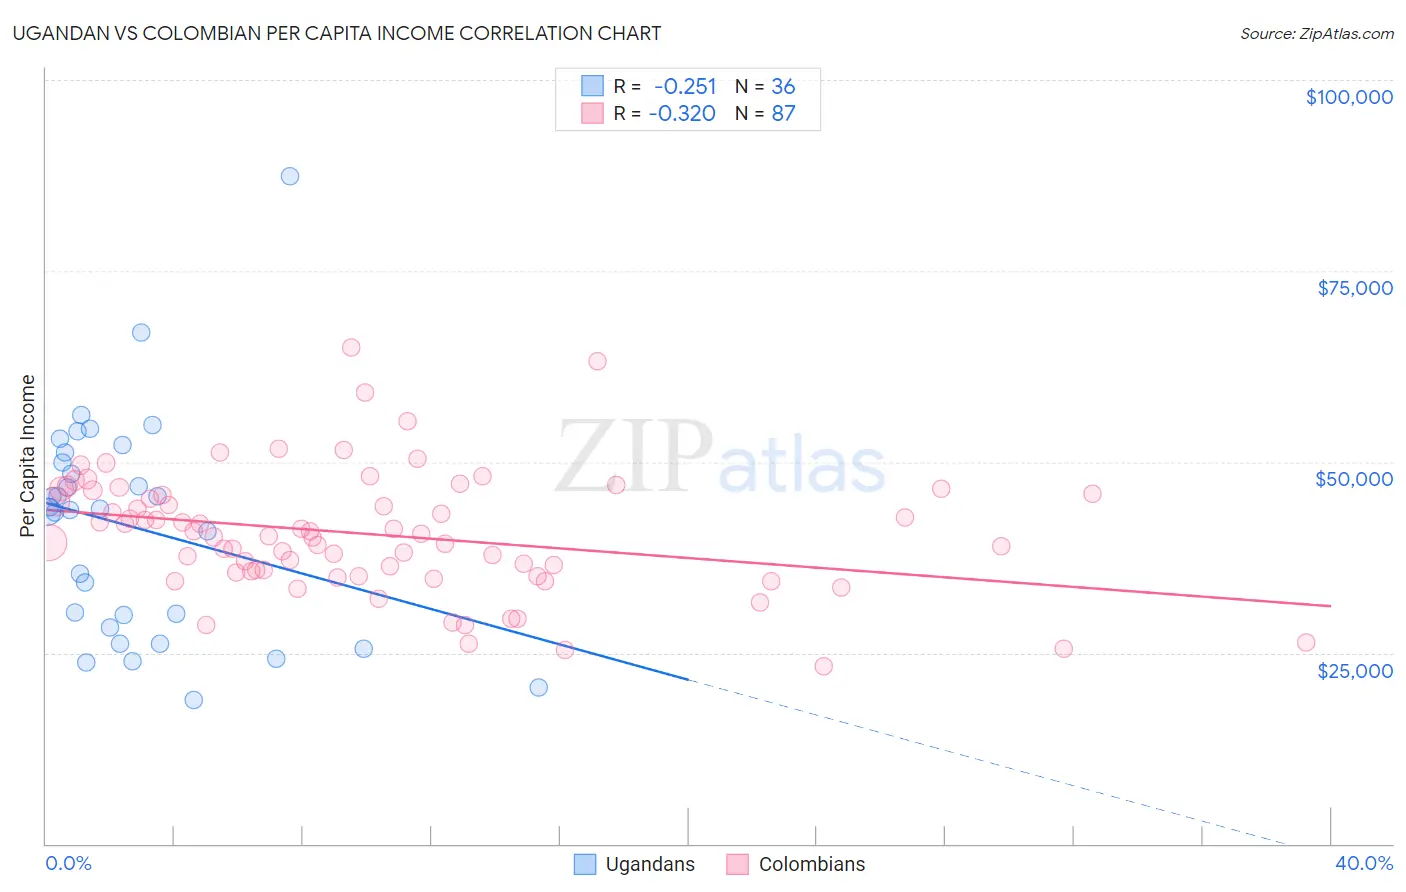
Ugandan vs Colombian Per Capita Income Correlation Chart
The statistical analysis conducted on geographies consisting of 94,012,894 people shows a weak negative correlation between the proportion of Ugandans and per capita income in the United States with a correlation coefficient (R) of -0.251 and weighted average of $45,047. Similarly, the statistical analysis conducted on geographies consisting of 419,718,902 people shows a mild negative correlation between the proportion of Colombians and per capita income in the United States with a correlation coefficient (R) of -0.320 and weighted average of $43,661, a difference of 3.2%.
Per Capita Income Correlation Summary
| Measurement | Ugandan | Colombian |
| Minimum | $18,741 | $23,272 |
| Maximum | $87,401 | $65,011 |
| Range | $68,660 | $41,739 |
| Mean | $41,524 | $40,509 |
| Median | $43,788 | $40,249 |
| Interquartile 25% (IQ1) | $29,158 | $35,498 |
| Interquartile 75% (IQ3) | $50,579 | $45,774 |
| Interquartile Range (IQR) | $21,420 | $10,276 |
| Standard Deviation (Sample) | $14,466 | $7,993 |
| Standard Deviation (Population) | $14,264 | $7,947 |
Similar Demographics by Per Capita Income
Demographics Similar to Ugandans by Per Capita Income
In terms of per capita income, the demographic groups most similar to Ugandans are Slavic ($45,049, a difference of 0.0%), Immigrants from Uganda ($45,043, a difference of 0.010%), Immigrants from Jordan ($45,066, a difference of 0.040%), Basque ($45,086, a difference of 0.090%), and Icelander ($44,987, a difference of 0.13%).
| Demographics | Rating | Rank | Per Capita Income |
| Hungarians | 87.9 /100 | #135 | Excellent $45,426 |
| Immigrants | Oceania | 85.2 /100 | #136 | Excellent $45,220 |
| Immigrants | Syria | 85.2 /100 | #137 | Excellent $45,218 |
| Assyrians/Chaldeans/Syriacs | 84.8 /100 | #138 | Excellent $45,195 |
| Basques | 83.2 /100 | #139 | Excellent $45,086 |
| Immigrants | Jordan | 82.9 /100 | #140 | Excellent $45,066 |
| Slavs | 82.6 /100 | #141 | Excellent $45,049 |
| Ugandans | 82.6 /100 | #142 | Excellent $45,047 |
| Immigrants | Uganda | 82.5 /100 | #143 | Excellent $45,043 |
| Icelanders | 81.6 /100 | #144 | Excellent $44,987 |
| Immigrants | Afghanistan | 78.0 /100 | #145 | Good $44,790 |
| Irish | 75.8 /100 | #146 | Good $44,679 |
| Czechs | 74.1 /100 | #147 | Good $44,595 |
| Immigrants | Armenia | 73.1 /100 | #148 | Good $44,552 |
| Koreans | 72.5 /100 | #149 | Good $44,522 |
Demographics Similar to Colombians by Per Capita Income
In terms of per capita income, the demographic groups most similar to Colombians are French ($43,685, a difference of 0.060%), Celtic ($43,621, a difference of 0.090%), Immigrants from South Eastern Asia ($43,539, a difference of 0.28%), Czechoslovakian ($43,806, a difference of 0.33%), and Tlingit-Haida ($43,516, a difference of 0.33%).
| Demographics | Rating | Rank | Per Capita Income |
| English | 58.9 /100 | #167 | Average $43,982 |
| Belgians | 58.1 /100 | #168 | Average $43,951 |
| Immigrants | Peru | 55.3 /100 | #169 | Average $43,852 |
| Scandinavians | 55.2 /100 | #170 | Average $43,848 |
| Immigrants | Eastern Africa | 54.9 /100 | #171 | Average $43,838 |
| Czechoslovakians | 54.1 /100 | #172 | Average $43,806 |
| French | 50.7 /100 | #173 | Average $43,685 |
| Colombians | 50.0 /100 | #174 | Average $43,661 |
| Celtics | 48.9 /100 | #175 | Average $43,621 |
| Immigrants | South Eastern Asia | 46.6 /100 | #176 | Average $43,539 |
| Tlingit-Haida | 45.9 /100 | #177 | Average $43,516 |
| Immigrants | Costa Rica | 44.5 /100 | #178 | Average $43,464 |
| Finns | 44.4 /100 | #179 | Average $43,461 |
| Sierra Leoneans | 42.9 /100 | #180 | Average $43,405 |
| Welsh | 38.2 /100 | #181 | Fair $43,233 |