Ugandan vs Asian Per Capita Income
COMPARE
Ugandan
Asian
Per Capita Income
Per Capita Income Comparison
Ugandans
Asians
$45,047
PER CAPITA INCOME
82.6/ 100
METRIC RATING
142nd/ 347
METRIC RANK
$50,057
PER CAPITA INCOME
99.9/ 100
METRIC RATING
56th/ 347
METRIC RANK
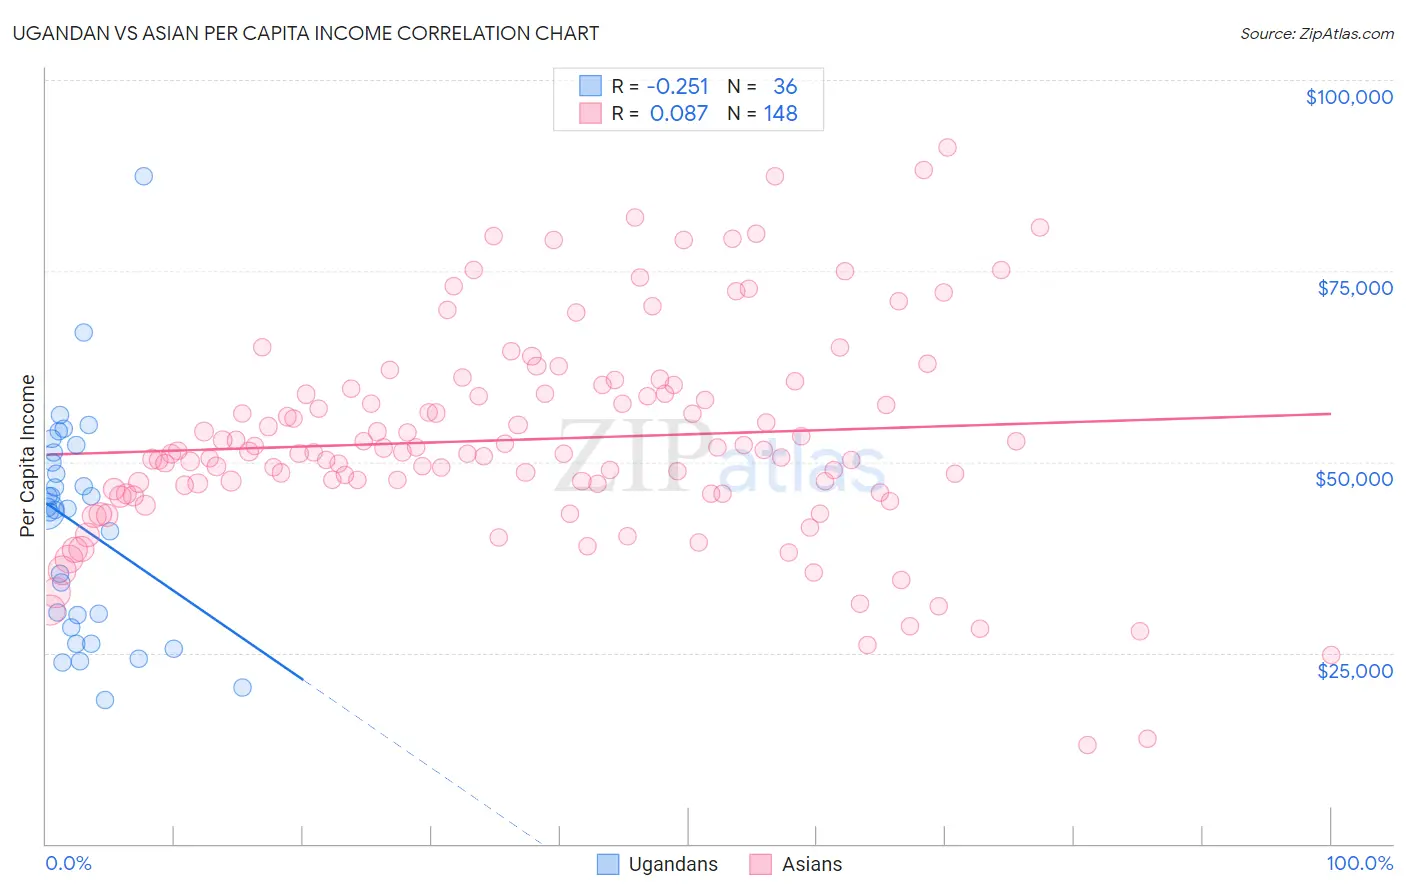
Ugandan vs Asian Per Capita Income Correlation Chart
The statistical analysis conducted on geographies consisting of 94,012,894 people shows a weak negative correlation between the proportion of Ugandans and per capita income in the United States with a correlation coefficient (R) of -0.251 and weighted average of $45,047. Similarly, the statistical analysis conducted on geographies consisting of 550,984,990 people shows a slight positive correlation between the proportion of Asians and per capita income in the United States with a correlation coefficient (R) of 0.087 and weighted average of $50,057, a difference of 11.1%.
Per Capita Income Correlation Summary
| Measurement | Ugandan | Asian |
| Minimum | $18,741 | $12,941 |
| Maximum | $87,401 | $91,125 |
| Range | $68,660 | $78,184 |
| Mean | $41,524 | $52,955 |
| Median | $43,788 | $51,252 |
| Interquartile 25% (IQ1) | $29,158 | $46,204 |
| Interquartile 75% (IQ3) | $50,579 | $59,246 |
| Interquartile Range (IQR) | $21,420 | $13,041 |
| Standard Deviation (Sample) | $14,466 | $13,804 |
| Standard Deviation (Population) | $14,264 | $13,757 |
Similar Demographics by Per Capita Income
Demographics Similar to Ugandans by Per Capita Income
In terms of per capita income, the demographic groups most similar to Ugandans are Slavic ($45,049, a difference of 0.0%), Immigrants from Uganda ($45,043, a difference of 0.010%), Immigrants from Jordan ($45,066, a difference of 0.040%), Basque ($45,086, a difference of 0.090%), and Icelander ($44,987, a difference of 0.13%).
| Demographics | Rating | Rank | Per Capita Income |
| Hungarians | 87.9 /100 | #135 | Excellent $45,426 |
| Immigrants | Oceania | 85.2 /100 | #136 | Excellent $45,220 |
| Immigrants | Syria | 85.2 /100 | #137 | Excellent $45,218 |
| Assyrians/Chaldeans/Syriacs | 84.8 /100 | #138 | Excellent $45,195 |
| Basques | 83.2 /100 | #139 | Excellent $45,086 |
| Immigrants | Jordan | 82.9 /100 | #140 | Excellent $45,066 |
| Slavs | 82.6 /100 | #141 | Excellent $45,049 |
| Ugandans | 82.6 /100 | #142 | Excellent $45,047 |
| Immigrants | Uganda | 82.5 /100 | #143 | Excellent $45,043 |
| Icelanders | 81.6 /100 | #144 | Excellent $44,987 |
| Immigrants | Afghanistan | 78.0 /100 | #145 | Good $44,790 |
| Irish | 75.8 /100 | #146 | Good $44,679 |
| Czechs | 74.1 /100 | #147 | Good $44,595 |
| Immigrants | Armenia | 73.1 /100 | #148 | Good $44,552 |
| Koreans | 72.5 /100 | #149 | Good $44,522 |
Demographics Similar to Asians by Per Capita Income
In terms of per capita income, the demographic groups most similar to Asians are Immigrants from Western Europe ($50,065, a difference of 0.020%), South African ($50,044, a difference of 0.030%), Immigrants from Malaysia ($49,983, a difference of 0.15%), Bhutanese ($49,894, a difference of 0.33%), and Immigrants from Scotland ($49,893, a difference of 0.33%).
| Demographics | Rating | Rank | Per Capita Income |
| New Zealanders | 100.0 /100 | #49 | Exceptional $50,575 |
| Immigrants | Sri Lanka | 100.0 /100 | #50 | Exceptional $50,555 |
| Immigrants | Netherlands | 100.0 /100 | #51 | Exceptional $50,458 |
| Immigrants | Croatia | 99.9 /100 | #52 | Exceptional $50,417 |
| Paraguayans | 99.9 /100 | #53 | Exceptional $50,385 |
| Immigrants | Belarus | 99.9 /100 | #54 | Exceptional $50,303 |
| Immigrants | Western Europe | 99.9 /100 | #55 | Exceptional $50,065 |
| Asians | 99.9 /100 | #56 | Exceptional $50,057 |
| South Africans | 99.9 /100 | #57 | Exceptional $50,044 |
| Immigrants | Malaysia | 99.9 /100 | #58 | Exceptional $49,983 |
| Bhutanese | 99.9 /100 | #59 | Exceptional $49,894 |
| Immigrants | Scotland | 99.9 /100 | #60 | Exceptional $49,893 |
| Argentineans | 99.9 /100 | #61 | Exceptional $49,862 |
| Immigrants | Asia | 99.9 /100 | #62 | Exceptional $49,741 |
| Maltese | 99.9 /100 | #63 | Exceptional $49,640 |