Ugandan vs Costa Rican Per Capita Income
COMPARE
Ugandan
Costa Rican
Per Capita Income
Per Capita Income Comparison
Ugandans
Costa Ricans
$45,047
PER CAPITA INCOME
82.6/ 100
METRIC RATING
142nd/ 347
METRIC RANK
$44,090
PER CAPITA INCOME
61.8/ 100
METRIC RATING
161st/ 347
METRIC RANK
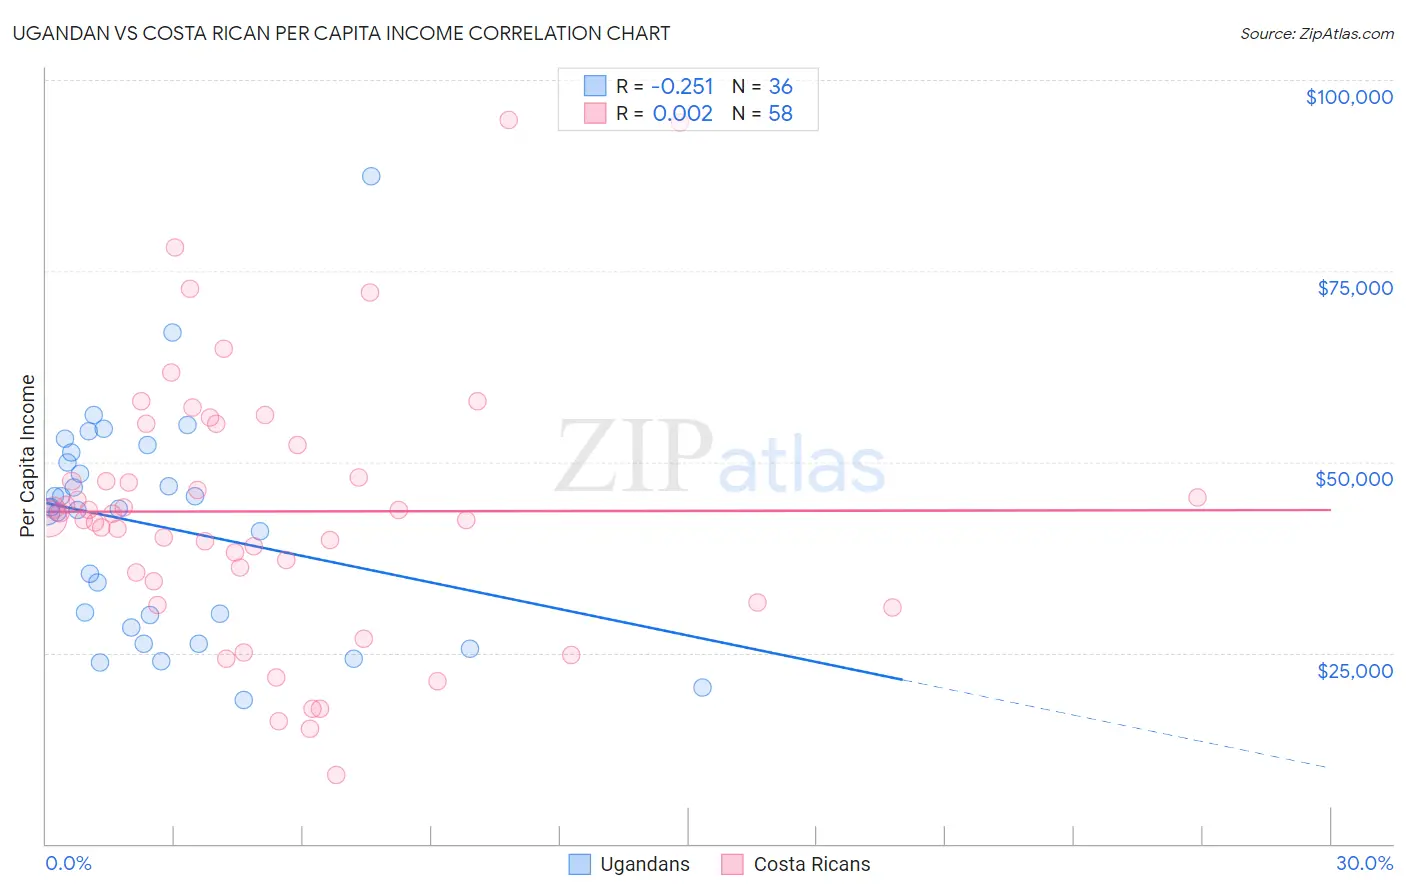
Ugandan vs Costa Rican Per Capita Income Correlation Chart
The statistical analysis conducted on geographies consisting of 94,012,894 people shows a weak negative correlation between the proportion of Ugandans and per capita income in the United States with a correlation coefficient (R) of -0.251 and weighted average of $45,047. Similarly, the statistical analysis conducted on geographies consisting of 253,595,957 people shows no correlation between the proportion of Costa Ricans and per capita income in the United States with a correlation coefficient (R) of 0.002 and weighted average of $44,090, a difference of 2.2%.
Per Capita Income Correlation Summary
| Measurement | Ugandan | Costa Rican |
| Minimum | $18,741 | $9,066 |
| Maximum | $87,401 | $94,709 |
| Range | $68,660 | $85,643 |
| Mean | $41,524 | $43,514 |
| Median | $43,788 | $42,885 |
| Interquartile 25% (IQ1) | $29,158 | $34,433 |
| Interquartile 75% (IQ3) | $50,579 | $52,139 |
| Interquartile Range (IQR) | $21,420 | $17,706 |
| Standard Deviation (Sample) | $14,466 | $17,472 |
| Standard Deviation (Population) | $14,264 | $17,321 |
Demographics Similar to Ugandans and Costa Ricans by Per Capita Income
In terms of per capita income, the demographic groups most similar to Ugandans are Slavic ($45,049, a difference of 0.0%), Immigrants from Uganda ($45,043, a difference of 0.010%), Icelander ($44,987, a difference of 0.13%), Immigrants from Afghanistan ($44,790, a difference of 0.57%), and Irish ($44,679, a difference of 0.82%). Similarly, the demographic groups most similar to Costa Ricans are Danish ($44,095, a difference of 0.010%), South American ($44,114, a difference of 0.050%), Immigrants from Nepal ($44,187, a difference of 0.22%), South American Indian ($44,206, a difference of 0.26%), and Slovak ($44,229, a difference of 0.31%).
| Demographics | Rating | Rank | Per Capita Income |
| Slavs | 82.6 /100 | #141 | Excellent $45,049 |
| Ugandans | 82.6 /100 | #142 | Excellent $45,047 |
| Immigrants | Uganda | 82.5 /100 | #143 | Excellent $45,043 |
| Icelanders | 81.6 /100 | #144 | Excellent $44,987 |
| Immigrants | Afghanistan | 78.0 /100 | #145 | Good $44,790 |
| Irish | 75.8 /100 | #146 | Good $44,679 |
| Czechs | 74.1 /100 | #147 | Good $44,595 |
| Immigrants | Armenia | 73.1 /100 | #148 | Good $44,552 |
| Koreans | 72.5 /100 | #149 | Good $44,522 |
| Immigrants | Eritrea | 72.1 /100 | #150 | Good $44,509 |
| Norwegians | 71.5 /100 | #151 | Good $44,480 |
| Peruvians | 71.5 /100 | #152 | Good $44,479 |
| Scottish | 70.6 /100 | #153 | Good $44,440 |
| Portuguese | 68.7 /100 | #154 | Good $44,362 |
| Uruguayans | 67.6 /100 | #155 | Good $44,318 |
| Slovaks | 65.4 /100 | #156 | Good $44,229 |
| South American Indians | 64.8 /100 | #157 | Good $44,206 |
| Immigrants | Nepal | 64.3 /100 | #158 | Good $44,187 |
| South Americans | 62.4 /100 | #159 | Good $44,114 |
| Danes | 61.9 /100 | #160 | Good $44,095 |
| Costa Ricans | 61.8 /100 | #161 | Good $44,090 |