Ugandan vs Colombian Unemployment Among Ages 35 to 44 years
COMPARE
Ugandan
Colombian
Unemployment Among Ages 35 to 44 years
Unemployment Among Ages 35 to 44 years Comparison
Ugandans
Colombians
4.8%
UNEMPLOYMENT AMONG AGES 35 TO 44 YEARS
21.4/ 100
METRIC RATING
201st/ 347
METRIC RANK
4.6%
UNEMPLOYMENT AMONG AGES 35 TO 44 YEARS
80.8/ 100
METRIC RATING
132nd/ 347
METRIC RANK
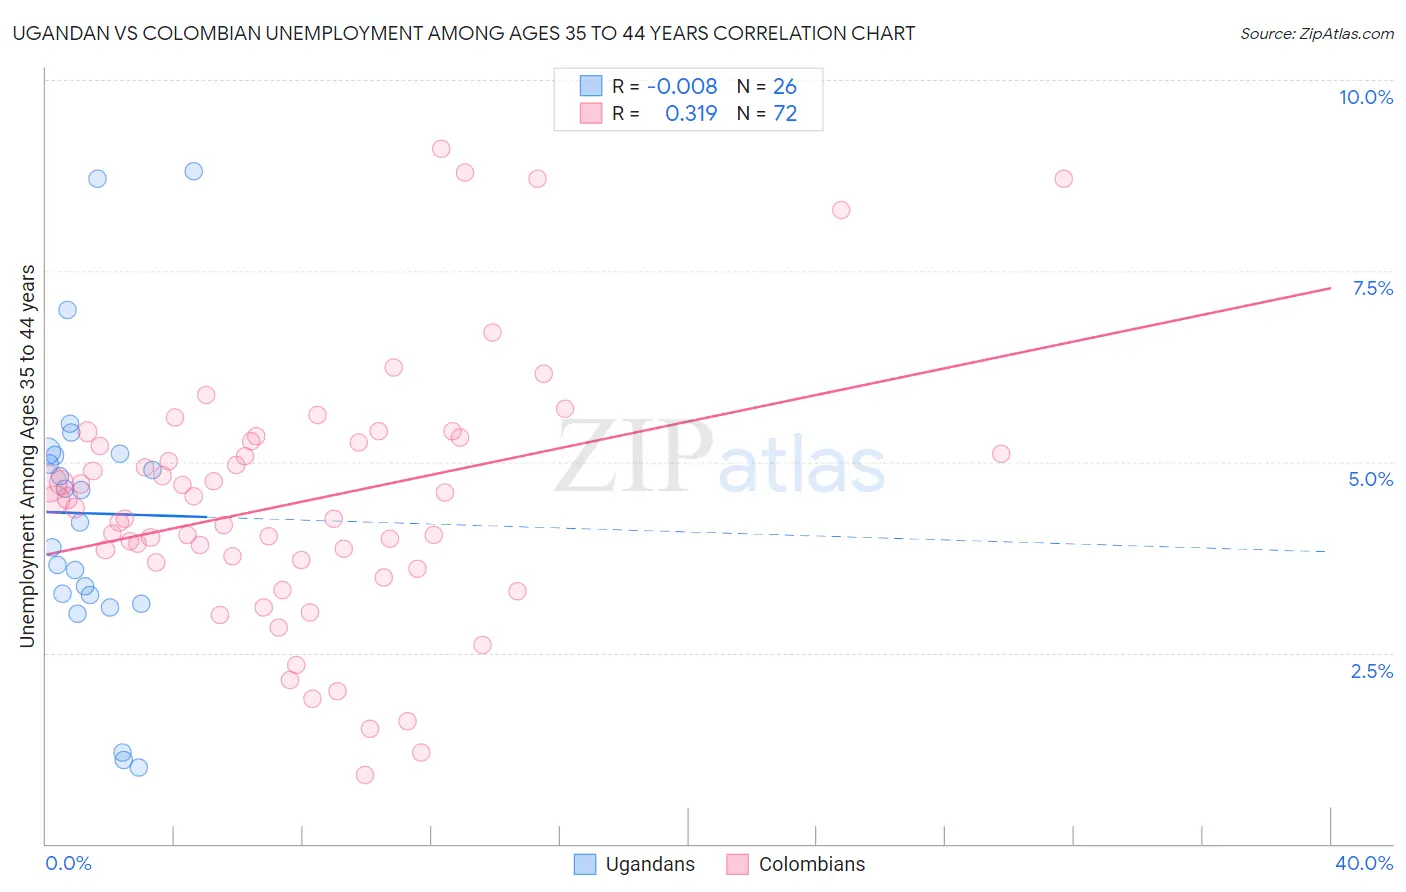
Ugandan vs Colombian Unemployment Among Ages 35 to 44 years Correlation Chart
The statistical analysis conducted on geographies consisting of 93,632,618 people shows no correlation between the proportion of Ugandans and unemployment rate among population between the ages 35 and 44 in the United States with a correlation coefficient (R) of -0.008 and weighted average of 4.8%. Similarly, the statistical analysis conducted on geographies consisting of 410,367,919 people shows a mild positive correlation between the proportion of Colombians and unemployment rate among population between the ages 35 and 44 in the United States with a correlation coefficient (R) of 0.319 and weighted average of 4.6%, a difference of 5.0%.
Unemployment Among Ages 35 to 44 years Correlation Summary
| Measurement | Ugandan | Colombian |
| Minimum | 1.0% | 0.90% |
| Maximum | 8.8% | 9.1% |
| Range | 7.8% | 8.2% |
| Mean | 4.3% | 4.5% |
| Median | 4.4% | 4.4% |
| Interquartile 25% (IQ1) | 3.3% | 3.7% |
| Interquartile 75% (IQ3) | 5.1% | 5.3% |
| Interquartile Range (IQR) | 1.8% | 1.6% |
| Standard Deviation (Sample) | 1.9% | 1.7% |
| Standard Deviation (Population) | 1.9% | 1.7% |
Similar Demographics by Unemployment Among Ages 35 to 44 years
Demographics Similar to Ugandans by Unemployment Among Ages 35 to 44 years
In terms of unemployment among ages 35 to 44 years, the demographic groups most similar to Ugandans are Immigrants from Ukraine (4.8%, a difference of 0.0%), Immigrants from Middle Africa (4.8%, a difference of 0.050%), Immigrants from Afghanistan (4.8%, a difference of 0.12%), Immigrants from Thailand (4.8%, a difference of 0.15%), and Uruguayan (4.8%, a difference of 0.15%).
| Demographics | Rating | Rank | Unemployment Among Ages 35 to 44 years |
| Koreans | 28.1 /100 | #194 | Fair 4.8% |
| Bangladeshis | 28.0 /100 | #195 | Fair 4.8% |
| Immigrants | Syria | 23.6 /100 | #196 | Fair 4.8% |
| Immigrants | Oceania | 23.2 /100 | #197 | Fair 4.8% |
| Immigrants | Thailand | 22.9 /100 | #198 | Fair 4.8% |
| Immigrants | Middle Africa | 21.9 /100 | #199 | Fair 4.8% |
| Immigrants | Ukraine | 21.4 /100 | #200 | Fair 4.8% |
| Ugandans | 21.4 /100 | #201 | Fair 4.8% |
| Immigrants | Afghanistan | 20.2 /100 | #202 | Fair 4.8% |
| Uruguayans | 20.0 /100 | #203 | Fair 4.8% |
| Immigrants | Philippines | 19.8 /100 | #204 | Poor 4.8% |
| Spaniards | 18.7 /100 | #205 | Poor 4.8% |
| Soviet Union | 18.4 /100 | #206 | Poor 4.8% |
| Immigrants | Western Asia | 16.6 /100 | #207 | Poor 4.8% |
| French Canadians | 16.5 /100 | #208 | Poor 4.8% |
Demographics Similar to Colombians by Unemployment Among Ages 35 to 44 years
In terms of unemployment among ages 35 to 44 years, the demographic groups most similar to Colombians are Syrian (4.6%, a difference of 0.020%), Laotian (4.6%, a difference of 0.080%), Immigrants from Europe (4.6%, a difference of 0.16%), Scotch-Irish (4.6%, a difference of 0.17%), and Immigrants from Iraq (4.6%, a difference of 0.21%).
| Demographics | Rating | Rank | Unemployment Among Ages 35 to 44 years |
| Immigrants | Northern Africa | 86.1 /100 | #125 | Excellent 4.5% |
| Immigrants | Austria | 84.7 /100 | #126 | Excellent 4.5% |
| Immigrants | Ethiopia | 84.7 /100 | #127 | Excellent 4.5% |
| Czechoslovakians | 83.4 /100 | #128 | Excellent 4.6% |
| Immigrants | Croatia | 83.1 /100 | #129 | Excellent 4.6% |
| Immigrants | Eritrea | 82.8 /100 | #130 | Excellent 4.6% |
| Immigrants | Colombia | 82.6 /100 | #131 | Excellent 4.6% |
| Colombians | 80.8 /100 | #132 | Excellent 4.6% |
| Syrians | 80.7 /100 | #133 | Excellent 4.6% |
| Laotians | 80.1 /100 | #134 | Excellent 4.6% |
| Immigrants | Europe | 79.4 /100 | #135 | Good 4.6% |
| Scotch-Irish | 79.3 /100 | #136 | Good 4.6% |
| Immigrants | Iraq | 78.9 /100 | #137 | Good 4.6% |
| Immigrants | Norway | 77.5 /100 | #138 | Good 4.6% |
| Immigrants | Hungary | 76.3 /100 | #139 | Good 4.6% |