Spanish American vs Colombian Per Capita Income
COMPARE
Spanish American
Colombian
Per Capita Income
Per Capita Income Comparison
Spanish Americans
Colombians
$39,012
PER CAPITA INCOME
0.5/ 100
METRIC RATING
265th/ 347
METRIC RANK
$43,661
PER CAPITA INCOME
50.0/ 100
METRIC RATING
174th/ 347
METRIC RANK
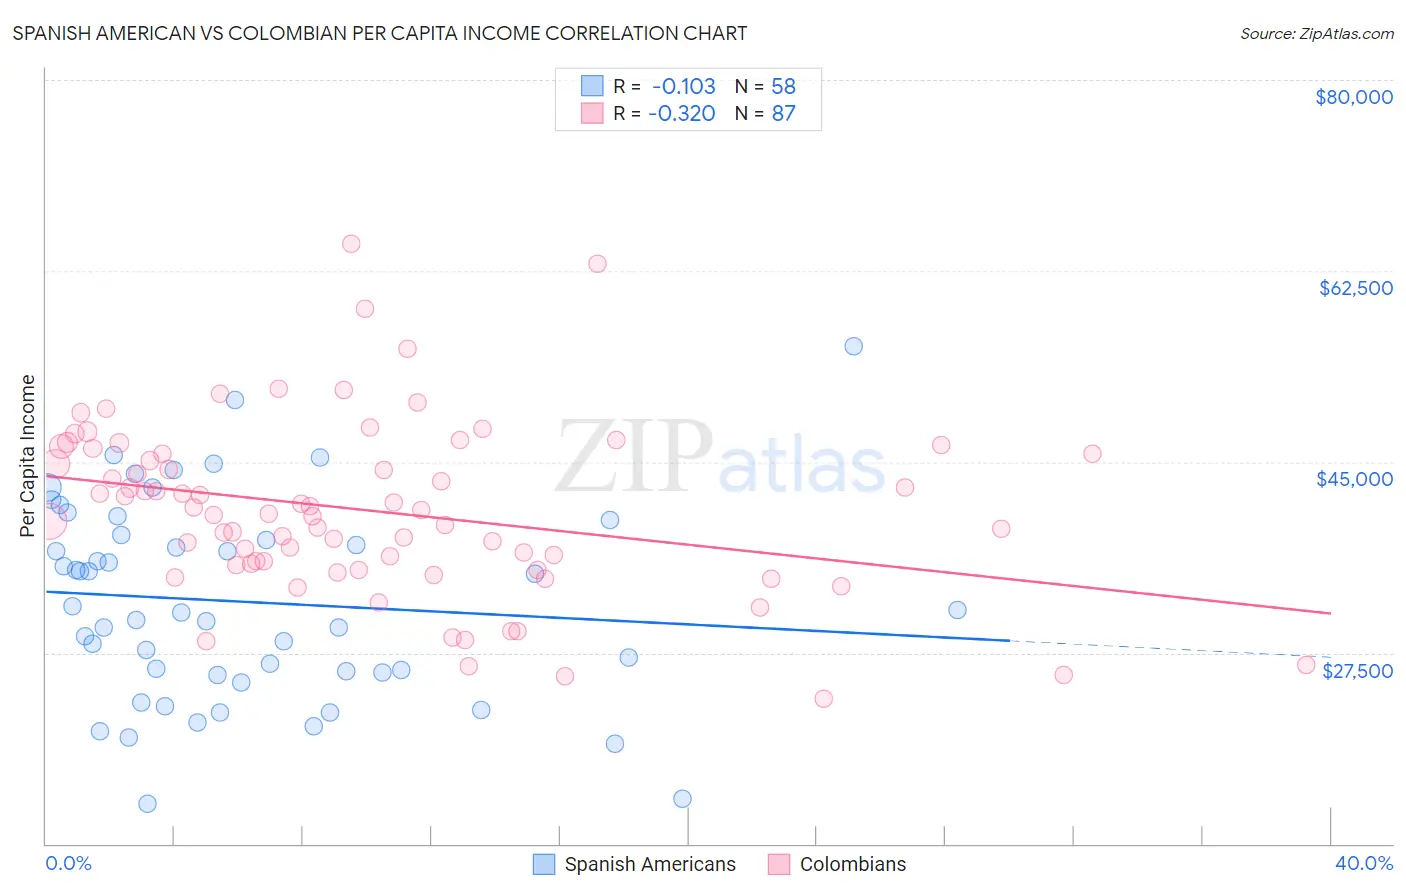
Spanish American vs Colombian Per Capita Income Correlation Chart
The statistical analysis conducted on geographies consisting of 103,168,021 people shows a poor negative correlation between the proportion of Spanish Americans and per capita income in the United States with a correlation coefficient (R) of -0.103 and weighted average of $39,012. Similarly, the statistical analysis conducted on geographies consisting of 419,718,902 people shows a mild negative correlation between the proportion of Colombians and per capita income in the United States with a correlation coefficient (R) of -0.320 and weighted average of $43,661, a difference of 11.9%.
Per Capita Income Correlation Summary
| Measurement | Spanish American | Colombian |
| Minimum | $13,649 | $23,272 |
| Maximum | $55,562 | $65,011 |
| Range | $41,913 | $41,739 |
| Mean | $32,169 | $40,509 |
| Median | $31,264 | $40,249 |
| Interquartile 25% (IQ1) | $25,700 | $35,498 |
| Interquartile 75% (IQ3) | $38,250 | $45,774 |
| Interquartile Range (IQR) | $12,550 | $10,276 |
| Standard Deviation (Sample) | $9,124 | $7,993 |
| Standard Deviation (Population) | $9,045 | $7,947 |
Similar Demographics by Per Capita Income
Demographics Similar to Spanish Americans by Per Capita Income
In terms of per capita income, the demographic groups most similar to Spanish Americans are American ($39,039, a difference of 0.070%), Belizean ($39,097, a difference of 0.22%), Iroquois ($39,104, a difference of 0.23%), Marshallese ($39,108, a difference of 0.25%), and Alaskan Athabascan ($39,163, a difference of 0.39%).
| Demographics | Rating | Rank | Per Capita Income |
| Jamaicans | 0.7 /100 | #258 | Tragic $39,231 |
| Malaysians | 0.7 /100 | #259 | Tragic $39,194 |
| Alaskan Athabascans | 0.6 /100 | #260 | Tragic $39,163 |
| Marshallese | 0.6 /100 | #261 | Tragic $39,108 |
| Iroquois | 0.6 /100 | #262 | Tragic $39,104 |
| Belizeans | 0.6 /100 | #263 | Tragic $39,097 |
| Americans | 0.6 /100 | #264 | Tragic $39,039 |
| Spanish Americans | 0.5 /100 | #265 | Tragic $39,012 |
| Salvadorans | 0.5 /100 | #266 | Tragic $38,858 |
| Immigrants | Zaire | 0.4 /100 | #267 | Tragic $38,848 |
| Liberians | 0.4 /100 | #268 | Tragic $38,780 |
| Immigrants | Jamaica | 0.4 /100 | #269 | Tragic $38,766 |
| Immigrants | Belize | 0.3 /100 | #270 | Tragic $38,614 |
| Central Americans | 0.3 /100 | #271 | Tragic $38,560 |
| Immigrants | Cabo Verde | 0.3 /100 | #272 | Tragic $38,540 |
Demographics Similar to Colombians by Per Capita Income
In terms of per capita income, the demographic groups most similar to Colombians are French ($43,685, a difference of 0.060%), Celtic ($43,621, a difference of 0.090%), Immigrants from South Eastern Asia ($43,539, a difference of 0.28%), Czechoslovakian ($43,806, a difference of 0.33%), and Tlingit-Haida ($43,516, a difference of 0.33%).
| Demographics | Rating | Rank | Per Capita Income |
| English | 58.9 /100 | #167 | Average $43,982 |
| Belgians | 58.1 /100 | #168 | Average $43,951 |
| Immigrants | Peru | 55.3 /100 | #169 | Average $43,852 |
| Scandinavians | 55.2 /100 | #170 | Average $43,848 |
| Immigrants | Eastern Africa | 54.9 /100 | #171 | Average $43,838 |
| Czechoslovakians | 54.1 /100 | #172 | Average $43,806 |
| French | 50.7 /100 | #173 | Average $43,685 |
| Colombians | 50.0 /100 | #174 | Average $43,661 |
| Celtics | 48.9 /100 | #175 | Average $43,621 |
| Immigrants | South Eastern Asia | 46.6 /100 | #176 | Average $43,539 |
| Tlingit-Haida | 45.9 /100 | #177 | Average $43,516 |
| Immigrants | Costa Rica | 44.5 /100 | #178 | Average $43,464 |
| Finns | 44.4 /100 | #179 | Average $43,461 |
| Sierra Leoneans | 42.9 /100 | #180 | Average $43,405 |
| Welsh | 38.2 /100 | #181 | Fair $43,233 |