Ugandan vs Immigrants from Cameroon Per Capita Income
COMPARE
Ugandan
Immigrants from Cameroon
Per Capita Income
Per Capita Income Comparison
Ugandans
Immigrants from Cameroon
$45,047
PER CAPITA INCOME
82.6/ 100
METRIC RATING
142nd/ 347
METRIC RANK
$41,334
PER CAPITA INCOME
6.8/ 100
METRIC RATING
223rd/ 347
METRIC RANK
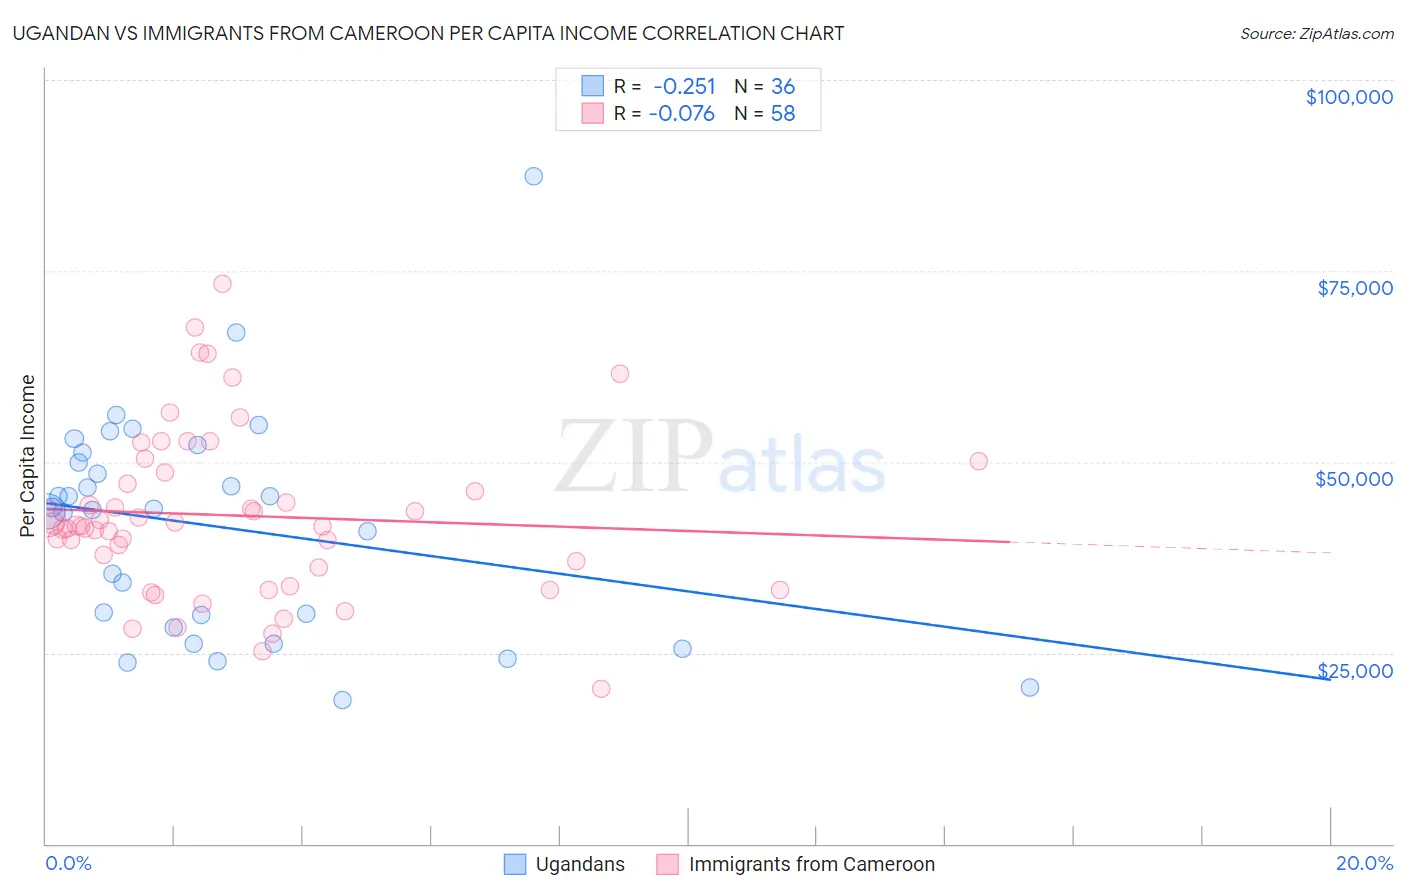
Ugandan vs Immigrants from Cameroon Per Capita Income Correlation Chart
The statistical analysis conducted on geographies consisting of 94,012,894 people shows a weak negative correlation between the proportion of Ugandans and per capita income in the United States with a correlation coefficient (R) of -0.251 and weighted average of $45,047. Similarly, the statistical analysis conducted on geographies consisting of 130,769,320 people shows a slight negative correlation between the proportion of Immigrants from Cameroon and per capita income in the United States with a correlation coefficient (R) of -0.076 and weighted average of $41,334, a difference of 9.0%.
Per Capita Income Correlation Summary
| Measurement | Ugandan | Immigrants from Cameroon |
| Minimum | $18,741 | $20,282 |
| Maximum | $87,401 | $73,301 |
| Range | $68,660 | $53,019 |
| Mean | $41,524 | $42,979 |
| Median | $43,788 | $41,647 |
| Interquartile 25% (IQ1) | $29,158 | $36,092 |
| Interquartile 75% (IQ3) | $50,579 | $48,673 |
| Interquartile Range (IQR) | $21,420 | $12,582 |
| Standard Deviation (Sample) | $14,466 | $10,877 |
| Standard Deviation (Population) | $14,264 | $10,783 |
Similar Demographics by Per Capita Income
Demographics Similar to Ugandans by Per Capita Income
In terms of per capita income, the demographic groups most similar to Ugandans are Slavic ($45,049, a difference of 0.0%), Immigrants from Uganda ($45,043, a difference of 0.010%), Immigrants from Jordan ($45,066, a difference of 0.040%), Basque ($45,086, a difference of 0.090%), and Icelander ($44,987, a difference of 0.13%).
| Demographics | Rating | Rank | Per Capita Income |
| Hungarians | 87.9 /100 | #135 | Excellent $45,426 |
| Immigrants | Oceania | 85.2 /100 | #136 | Excellent $45,220 |
| Immigrants | Syria | 85.2 /100 | #137 | Excellent $45,218 |
| Assyrians/Chaldeans/Syriacs | 84.8 /100 | #138 | Excellent $45,195 |
| Basques | 83.2 /100 | #139 | Excellent $45,086 |
| Immigrants | Jordan | 82.9 /100 | #140 | Excellent $45,066 |
| Slavs | 82.6 /100 | #141 | Excellent $45,049 |
| Ugandans | 82.6 /100 | #142 | Excellent $45,047 |
| Immigrants | Uganda | 82.5 /100 | #143 | Excellent $45,043 |
| Icelanders | 81.6 /100 | #144 | Excellent $44,987 |
| Immigrants | Afghanistan | 78.0 /100 | #145 | Good $44,790 |
| Irish | 75.8 /100 | #146 | Good $44,679 |
| Czechs | 74.1 /100 | #147 | Good $44,595 |
| Immigrants | Armenia | 73.1 /100 | #148 | Good $44,552 |
| Koreans | 72.5 /100 | #149 | Good $44,522 |
Demographics Similar to Immigrants from Cameroon by Per Capita Income
In terms of per capita income, the demographic groups most similar to Immigrants from Cameroon are Immigrants from Iraq ($41,365, a difference of 0.070%), Immigrants from St. Vincent and the Grenadines ($41,270, a difference of 0.16%), West Indian ($41,217, a difference of 0.28%), Immigrants from Trinidad and Tobago ($41,476, a difference of 0.34%), and Immigrants from Ecuador ($41,195, a difference of 0.34%).
| Demographics | Rating | Rank | Per Capita Income |
| Tongans | 9.9 /100 | #216 | Tragic $41,693 |
| Guamanians/Chamorros | 9.7 /100 | #217 | Tragic $41,678 |
| Trinidadians and Tobagonians | 9.5 /100 | #218 | Tragic $41,655 |
| Puget Sound Salish | 8.1 /100 | #219 | Tragic $41,495 |
| Immigrants | Barbados | 7.9 /100 | #220 | Tragic $41,478 |
| Immigrants | Trinidad and Tobago | 7.9 /100 | #221 | Tragic $41,476 |
| Immigrants | Iraq | 7.1 /100 | #222 | Tragic $41,365 |
| Immigrants | Cameroon | 6.8 /100 | #223 | Tragic $41,334 |
| Immigrants | St. Vincent and the Grenadines | 6.4 /100 | #224 | Tragic $41,270 |
| West Indians | 6.0 /100 | #225 | Tragic $41,217 |
| Immigrants | Ecuador | 5.9 /100 | #226 | Tragic $41,195 |
| Immigrants | Ghana | 5.5 /100 | #227 | Tragic $41,131 |
| Immigrants | Grenada | 5.5 /100 | #228 | Tragic $41,123 |
| Nigerians | 4.9 /100 | #229 | Tragic $41,026 |
| Native Hawaiians | 4.9 /100 | #230 | Tragic $41,017 |