Ugandan vs Immigrants from Latvia Per Capita Income
COMPARE
Ugandan
Immigrants from Latvia
Per Capita Income
Per Capita Income Comparison
Ugandans
Immigrants from Latvia
$45,047
PER CAPITA INCOME
82.6/ 100
METRIC RATING
142nd/ 347
METRIC RANK
$50,914
PER CAPITA INCOME
100.0/ 100
METRIC RATING
46th/ 347
METRIC RANK
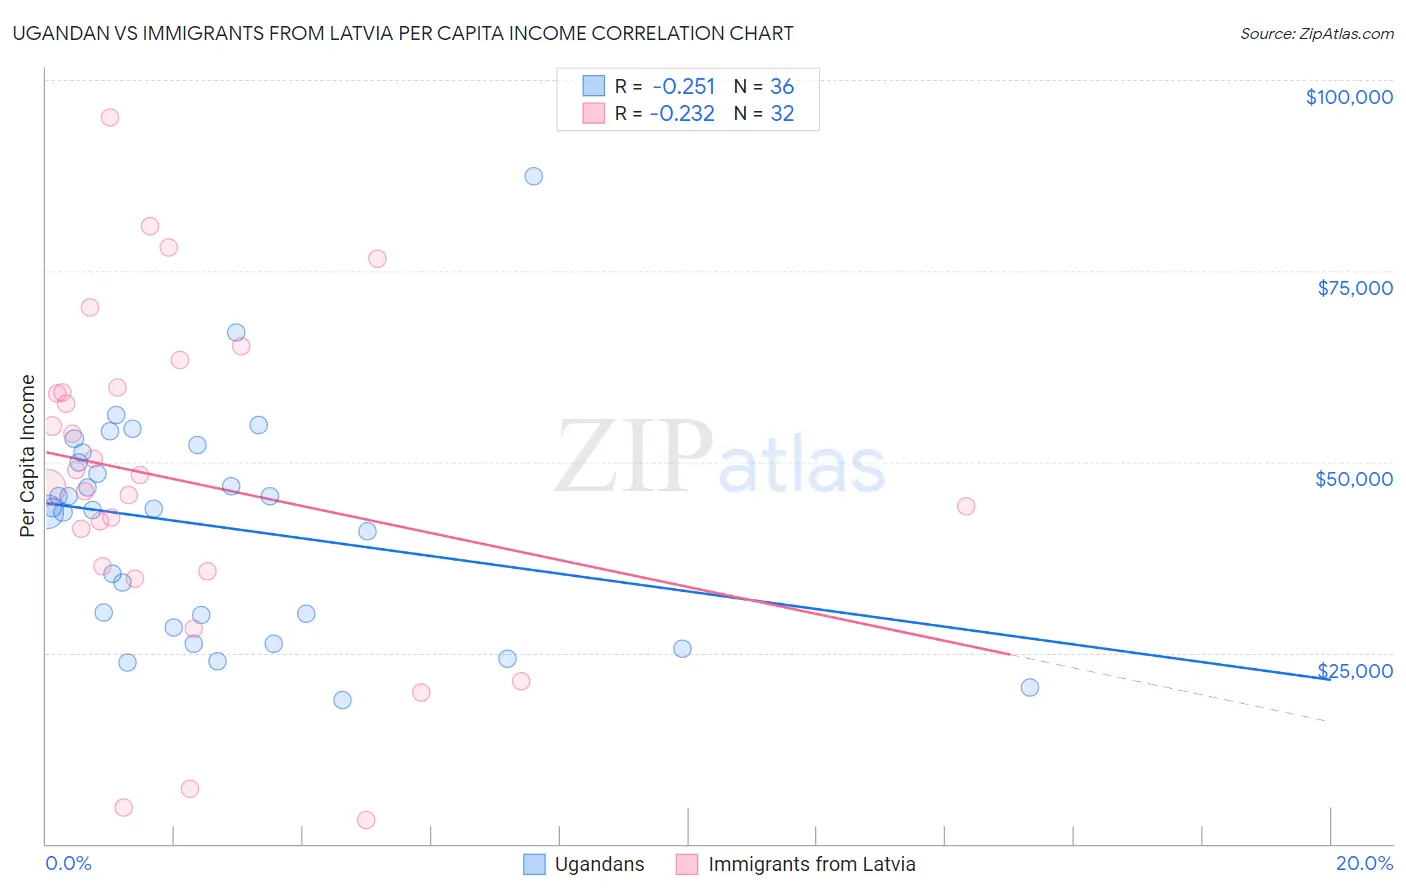
Ugandan vs Immigrants from Latvia Per Capita Income Correlation Chart
The statistical analysis conducted on geographies consisting of 94,012,894 people shows a weak negative correlation between the proportion of Ugandans and per capita income in the United States with a correlation coefficient (R) of -0.251 and weighted average of $45,047. Similarly, the statistical analysis conducted on geographies consisting of 113,739,608 people shows a weak negative correlation between the proportion of Immigrants from Latvia and per capita income in the United States with a correlation coefficient (R) of -0.232 and weighted average of $50,914, a difference of 13.0%.
Per Capita Income Correlation Summary
| Measurement | Ugandan | Immigrants from Latvia |
| Minimum | $18,741 | $3,055 |
| Maximum | $87,401 | $95,062 |
| Range | $68,660 | $92,007 |
| Mean | $41,524 | $47,518 |
| Median | $43,788 | $47,530 |
| Interquartile 25% (IQ1) | $29,158 | $35,985 |
| Interquartile 75% (IQ3) | $50,579 | $59,433 |
| Interquartile Range (IQR) | $21,420 | $23,448 |
| Standard Deviation (Sample) | $14,466 | $21,734 |
| Standard Deviation (Population) | $14,264 | $21,392 |
Similar Demographics by Per Capita Income
Demographics Similar to Ugandans by Per Capita Income
In terms of per capita income, the demographic groups most similar to Ugandans are Slavic ($45,049, a difference of 0.0%), Immigrants from Uganda ($45,043, a difference of 0.010%), Immigrants from Jordan ($45,066, a difference of 0.040%), Basque ($45,086, a difference of 0.090%), and Icelander ($44,987, a difference of 0.13%).
| Demographics | Rating | Rank | Per Capita Income |
| Hungarians | 87.9 /100 | #135 | Excellent $45,426 |
| Immigrants | Oceania | 85.2 /100 | #136 | Excellent $45,220 |
| Immigrants | Syria | 85.2 /100 | #137 | Excellent $45,218 |
| Assyrians/Chaldeans/Syriacs | 84.8 /100 | #138 | Excellent $45,195 |
| Basques | 83.2 /100 | #139 | Excellent $45,086 |
| Immigrants | Jordan | 82.9 /100 | #140 | Excellent $45,066 |
| Slavs | 82.6 /100 | #141 | Excellent $45,049 |
| Ugandans | 82.6 /100 | #142 | Excellent $45,047 |
| Immigrants | Uganda | 82.5 /100 | #143 | Excellent $45,043 |
| Icelanders | 81.6 /100 | #144 | Excellent $44,987 |
| Immigrants | Afghanistan | 78.0 /100 | #145 | Good $44,790 |
| Irish | 75.8 /100 | #146 | Good $44,679 |
| Czechs | 74.1 /100 | #147 | Good $44,595 |
| Immigrants | Armenia | 73.1 /100 | #148 | Good $44,552 |
| Koreans | 72.5 /100 | #149 | Good $44,522 |
Demographics Similar to Immigrants from Latvia by Per Capita Income
In terms of per capita income, the demographic groups most similar to Immigrants from Latvia are Bulgarian ($50,906, a difference of 0.020%), Immigrants from Spain ($50,933, a difference of 0.040%), Immigrants from Europe ($50,950, a difference of 0.070%), Immigrants from Serbia ($50,810, a difference of 0.21%), and New Zealander ($50,575, a difference of 0.67%).
| Demographics | Rating | Rank | Per Capita Income |
| Cambodians | 100.0 /100 | #39 | Exceptional $51,731 |
| Immigrants | Korea | 100.0 /100 | #40 | Exceptional $51,671 |
| Immigrants | South Africa | 100.0 /100 | #41 | Exceptional $51,465 |
| Immigrants | Turkey | 100.0 /100 | #42 | Exceptional $51,368 |
| Immigrants | Lithuania | 100.0 /100 | #43 | Exceptional $51,361 |
| Immigrants | Europe | 100.0 /100 | #44 | Exceptional $50,950 |
| Immigrants | Spain | 100.0 /100 | #45 | Exceptional $50,933 |
| Immigrants | Latvia | 100.0 /100 | #46 | Exceptional $50,914 |
| Bulgarians | 100.0 /100 | #47 | Exceptional $50,906 |
| Immigrants | Serbia | 100.0 /100 | #48 | Exceptional $50,810 |
| New Zealanders | 100.0 /100 | #49 | Exceptional $50,575 |
| Immigrants | Sri Lanka | 100.0 /100 | #50 | Exceptional $50,555 |
| Immigrants | Netherlands | 100.0 /100 | #51 | Exceptional $50,458 |
| Immigrants | Croatia | 99.9 /100 | #52 | Exceptional $50,417 |
| Paraguayans | 99.9 /100 | #53 | Exceptional $50,385 |