Ugandan vs Colombian High School Diploma
COMPARE
Ugandan
Colombian
High School Diploma
High School Diploma Comparison
Ugandans
Colombians
89.7%
HIGH SCHOOL DIPLOMA
83.7/ 100
METRIC RATING
136th/ 347
METRIC RANK
88.1%
HIGH SCHOOL DIPLOMA
3.8/ 100
METRIC RATING
231st/ 347
METRIC RANK
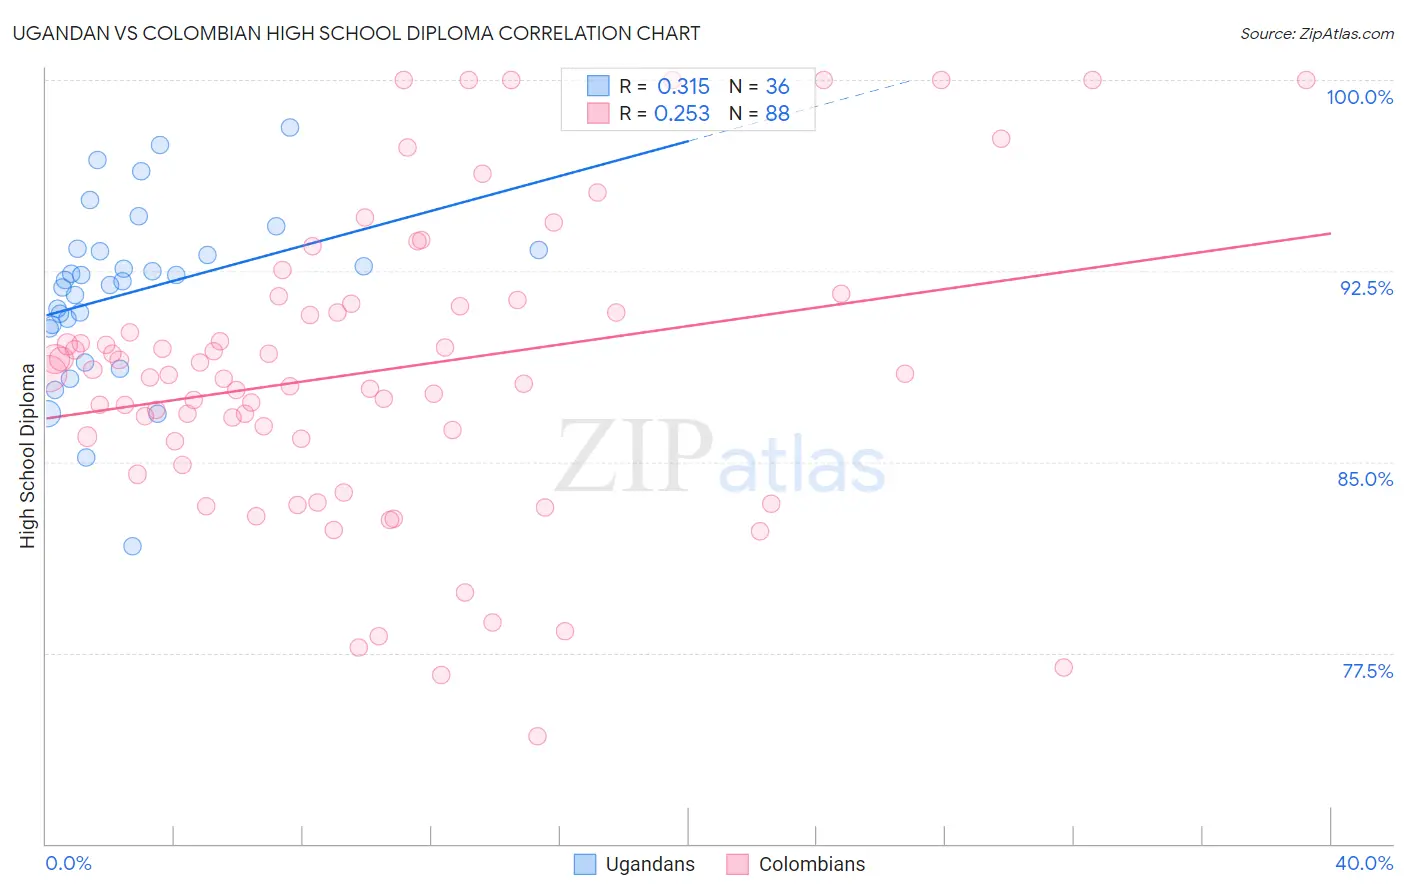
Ugandan vs Colombian High School Diploma Correlation Chart
The statistical analysis conducted on geographies consisting of 93,991,892 people shows a mild positive correlation between the proportion of Ugandans and percentage of population with at least high school diploma education in the United States with a correlation coefficient (R) of 0.315 and weighted average of 89.7%. Similarly, the statistical analysis conducted on geographies consisting of 419,701,311 people shows a weak positive correlation between the proportion of Colombians and percentage of population with at least high school diploma education in the United States with a correlation coefficient (R) of 0.253 and weighted average of 88.1%, a difference of 1.9%.
High School Diploma Correlation Summary
| Measurement | Ugandan | Colombian |
| Minimum | 81.7% | 74.2% |
| Maximum | 98.1% | 100.0% |
| Range | 16.4% | 25.8% |
| Mean | 91.6% | 88.6% |
| Median | 92.1% | 88.4% |
| Interquartile 25% (IQ1) | 90.3% | 85.9% |
| Interquartile 75% (IQ3) | 93.3% | 91.2% |
| Interquartile Range (IQR) | 3.0% | 5.3% |
| Standard Deviation (Sample) | 3.4% | 5.8% |
| Standard Deviation (Population) | 3.4% | 5.8% |
Similar Demographics by High School Diploma
Demographics Similar to Ugandans by High School Diploma
In terms of high school diploma, the demographic groups most similar to Ugandans are Arab (89.7%, a difference of 0.0%), Assyrian/Chaldean/Syriac (89.7%, a difference of 0.030%), Chippewa (89.7%, a difference of 0.060%), Kenyan (89.6%, a difference of 0.060%), and Immigrants from Egypt (89.6%, a difference of 0.070%).
| Demographics | Rating | Rank | High School Diploma |
| Basques | 88.5 /100 | #129 | Excellent 89.8% |
| Immigrants | Ukraine | 87.9 /100 | #130 | Excellent 89.8% |
| Immigrants | Italy | 87.4 /100 | #131 | Excellent 89.8% |
| Immigrants | Bosnia and Herzegovina | 87.3 /100 | #132 | Excellent 89.8% |
| Albanians | 87.2 /100 | #133 | Excellent 89.8% |
| Immigrants | Jordan | 87.2 /100 | #134 | Excellent 89.8% |
| Chippewa | 85.6 /100 | #135 | Excellent 89.7% |
| Ugandans | 83.7 /100 | #136 | Excellent 89.7% |
| Arabs | 83.6 /100 | #137 | Excellent 89.7% |
| Assyrians/Chaldeans/Syriacs | 82.5 /100 | #138 | Excellent 89.7% |
| Kenyans | 81.4 /100 | #139 | Excellent 89.6% |
| Immigrants | Egypt | 81.2 /100 | #140 | Excellent 89.6% |
| Chileans | 79.0 /100 | #141 | Good 89.6% |
| Indians (Asian) | 78.8 /100 | #142 | Good 89.6% |
| Pakistanis | 78.3 /100 | #143 | Good 89.6% |
Demographics Similar to Colombians by High School Diploma
In terms of high school diploma, the demographic groups most similar to Colombians are Blackfeet (88.1%, a difference of 0.040%), Immigrants from Middle Africa (88.0%, a difference of 0.050%), Immigrants from Panama (88.0%, a difference of 0.080%), Immigrants from Thailand (88.0%, a difference of 0.090%), and Immigrants from Bahamas (88.0%, a difference of 0.10%).
| Demographics | Rating | Rank | High School Diploma |
| Shoshone | 7.0 /100 | #224 | Tragic 88.3% |
| Creek | 6.9 /100 | #225 | Tragic 88.3% |
| Uruguayans | 5.6 /100 | #226 | Tragic 88.2% |
| Immigrants | Liberia | 5.5 /100 | #227 | Tragic 88.2% |
| Kiowa | 5.3 /100 | #228 | Tragic 88.2% |
| Nigerians | 5.2 /100 | #229 | Tragic 88.2% |
| Blackfeet | 4.2 /100 | #230 | Tragic 88.1% |
| Colombians | 3.8 /100 | #231 | Tragic 88.1% |
| Immigrants | Middle Africa | 3.4 /100 | #232 | Tragic 88.0% |
| Immigrants | Panama | 3.1 /100 | #233 | Tragic 88.0% |
| Immigrants | Thailand | 3.1 /100 | #234 | Tragic 88.0% |
| Immigrants | Bahamas | 2.9 /100 | #235 | Tragic 88.0% |
| Sub-Saharan Africans | 2.8 /100 | #236 | Tragic 87.9% |
| Taiwanese | 2.8 /100 | #237 | Tragic 87.9% |
| Sioux | 2.7 /100 | #238 | Tragic 87.9% |