Immigrants from Iraq vs Colombian Per Capita Income
COMPARE
Immigrants from Iraq
Colombian
Per Capita Income
Per Capita Income Comparison
Immigrants from Iraq
Colombians
$41,365
PER CAPITA INCOME
7.1/ 100
METRIC RATING
222nd/ 347
METRIC RANK
$43,661
PER CAPITA INCOME
50.0/ 100
METRIC RATING
174th/ 347
METRIC RANK
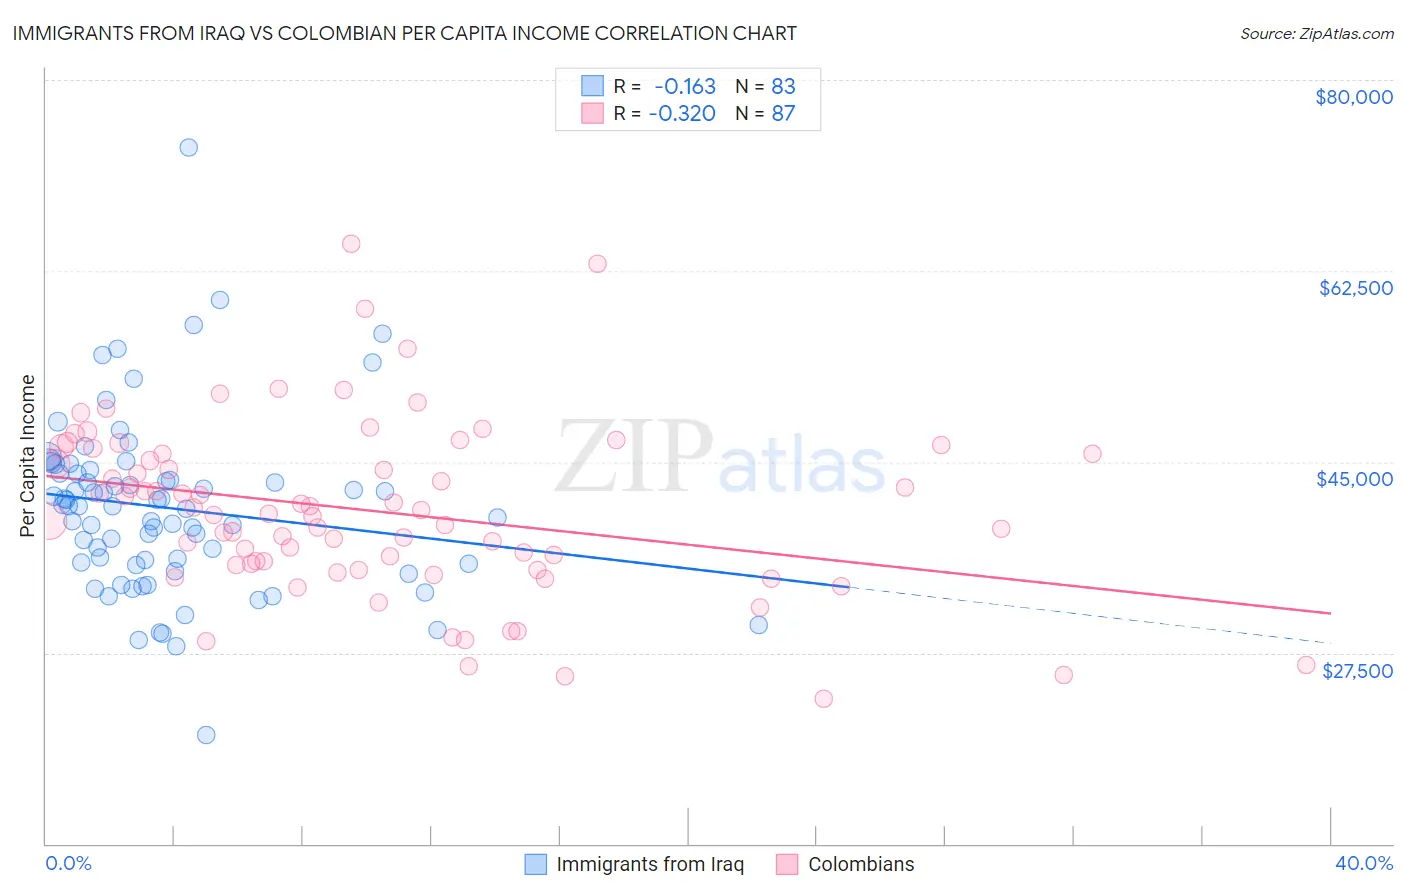
Immigrants from Iraq vs Colombian Per Capita Income Correlation Chart
The statistical analysis conducted on geographies consisting of 194,781,264 people shows a poor negative correlation between the proportion of Immigrants from Iraq and per capita income in the United States with a correlation coefficient (R) of -0.163 and weighted average of $41,365. Similarly, the statistical analysis conducted on geographies consisting of 419,718,902 people shows a mild negative correlation between the proportion of Colombians and per capita income in the United States with a correlation coefficient (R) of -0.320 and weighted average of $43,661, a difference of 5.6%.
Per Capita Income Correlation Summary
| Measurement | Immigrants from Iraq | Colombian |
| Minimum | $19,973 | $23,272 |
| Maximum | $73,810 | $65,011 |
| Range | $53,837 | $41,739 |
| Mean | $40,767 | $40,509 |
| Median | $40,988 | $40,249 |
| Interquartile 25% (IQ1) | $35,615 | $35,498 |
| Interquartile 75% (IQ3) | $43,922 | $45,774 |
| Interquartile Range (IQR) | $8,307 | $10,276 |
| Standard Deviation (Sample) | $8,068 | $7,993 |
| Standard Deviation (Population) | $8,019 | $7,947 |
Similar Demographics by Per Capita Income
Demographics Similar to Immigrants from Iraq by Per Capita Income
In terms of per capita income, the demographic groups most similar to Immigrants from Iraq are Immigrants from Cameroon ($41,334, a difference of 0.070%), Immigrants from St. Vincent and the Grenadines ($41,270, a difference of 0.23%), Immigrants from Barbados ($41,478, a difference of 0.27%), Immigrants from Trinidad and Tobago ($41,476, a difference of 0.27%), and Puget Sound Salish ($41,495, a difference of 0.31%).
| Demographics | Rating | Rank | Per Capita Income |
| Sudanese | 9.9 /100 | #215 | Tragic $41,695 |
| Tongans | 9.9 /100 | #216 | Tragic $41,693 |
| Guamanians/Chamorros | 9.7 /100 | #217 | Tragic $41,678 |
| Trinidadians and Tobagonians | 9.5 /100 | #218 | Tragic $41,655 |
| Puget Sound Salish | 8.1 /100 | #219 | Tragic $41,495 |
| Immigrants | Barbados | 7.9 /100 | #220 | Tragic $41,478 |
| Immigrants | Trinidad and Tobago | 7.9 /100 | #221 | Tragic $41,476 |
| Immigrants | Iraq | 7.1 /100 | #222 | Tragic $41,365 |
| Immigrants | Cameroon | 6.8 /100 | #223 | Tragic $41,334 |
| Immigrants | St. Vincent and the Grenadines | 6.4 /100 | #224 | Tragic $41,270 |
| West Indians | 6.0 /100 | #225 | Tragic $41,217 |
| Immigrants | Ecuador | 5.9 /100 | #226 | Tragic $41,195 |
| Immigrants | Ghana | 5.5 /100 | #227 | Tragic $41,131 |
| Immigrants | Grenada | 5.5 /100 | #228 | Tragic $41,123 |
| Nigerians | 4.9 /100 | #229 | Tragic $41,026 |
Demographics Similar to Colombians by Per Capita Income
In terms of per capita income, the demographic groups most similar to Colombians are French ($43,685, a difference of 0.060%), Celtic ($43,621, a difference of 0.090%), Immigrants from South Eastern Asia ($43,539, a difference of 0.28%), Czechoslovakian ($43,806, a difference of 0.33%), and Tlingit-Haida ($43,516, a difference of 0.33%).
| Demographics | Rating | Rank | Per Capita Income |
| English | 58.9 /100 | #167 | Average $43,982 |
| Belgians | 58.1 /100 | #168 | Average $43,951 |
| Immigrants | Peru | 55.3 /100 | #169 | Average $43,852 |
| Scandinavians | 55.2 /100 | #170 | Average $43,848 |
| Immigrants | Eastern Africa | 54.9 /100 | #171 | Average $43,838 |
| Czechoslovakians | 54.1 /100 | #172 | Average $43,806 |
| French | 50.7 /100 | #173 | Average $43,685 |
| Colombians | 50.0 /100 | #174 | Average $43,661 |
| Celtics | 48.9 /100 | #175 | Average $43,621 |
| Immigrants | South Eastern Asia | 46.6 /100 | #176 | Average $43,539 |
| Tlingit-Haida | 45.9 /100 | #177 | Average $43,516 |
| Immigrants | Costa Rica | 44.5 /100 | #178 | Average $43,464 |
| Finns | 44.4 /100 | #179 | Average $43,461 |
| Sierra Leoneans | 42.9 /100 | #180 | Average $43,405 |
| Welsh | 38.2 /100 | #181 | Fair $43,233 |