Immigrants from Sweden vs Assyrian/Chaldean/Syriac Median Male Earnings
COMPARE
Immigrants from Sweden
Assyrian/Chaldean/Syriac
Median Male Earnings
Median Male Earnings Comparison
Immigrants from Sweden
Assyrians/Chaldeans/Syriacs
$65,406
MEDIAN MALE EARNINGS
100.0/ 100
METRIC RATING
21st/ 347
METRIC RANK
$58,437
MEDIAN MALE EARNINGS
97.9/ 100
METRIC RATING
100th/ 347
METRIC RANK
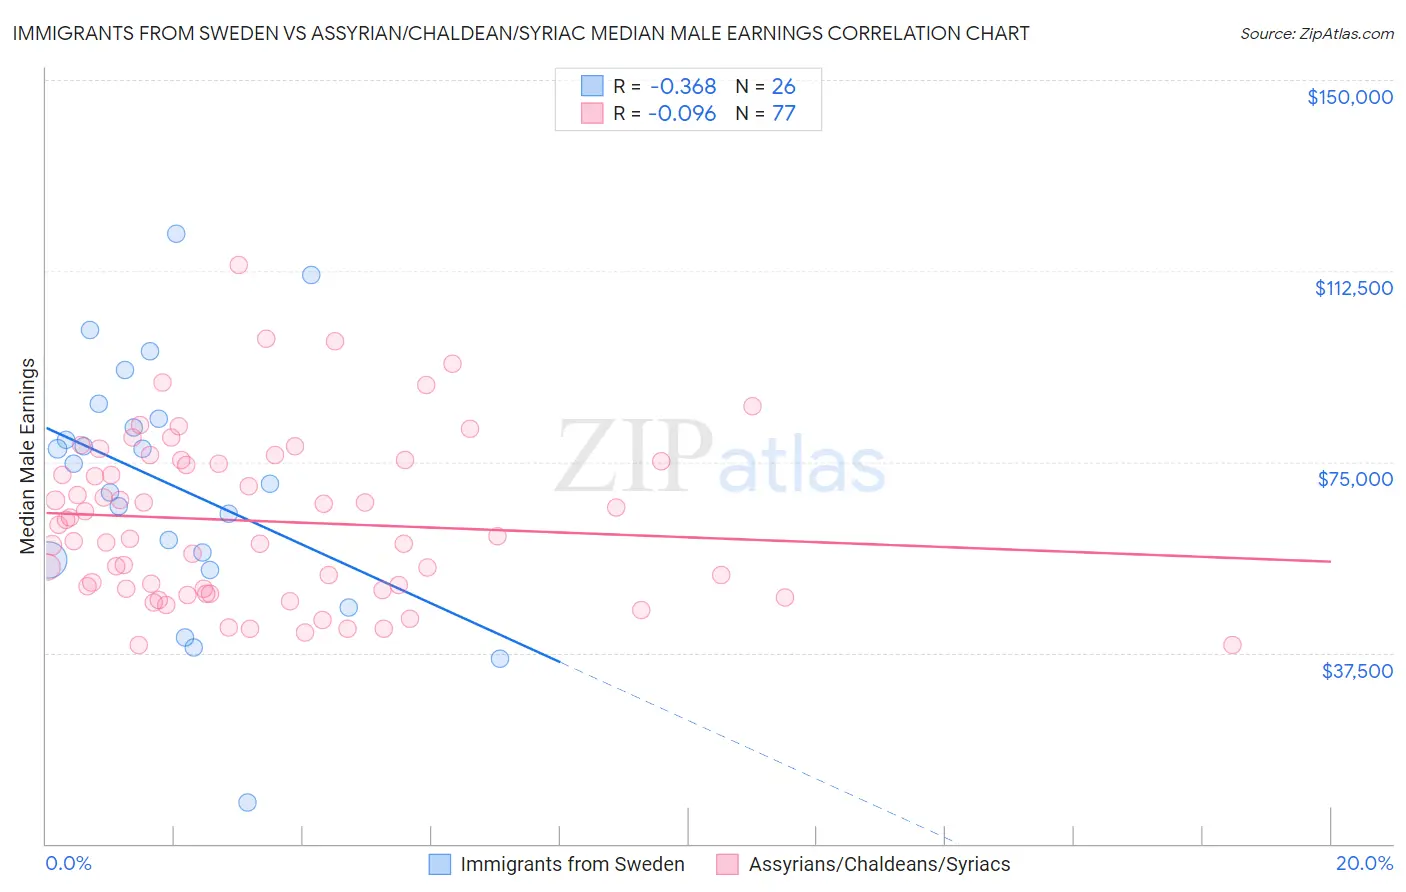
Immigrants from Sweden vs Assyrian/Chaldean/Syriac Median Male Earnings Correlation Chart
The statistical analysis conducted on geographies consisting of 164,719,286 people shows a mild negative correlation between the proportion of Immigrants from Sweden and median male earnings in the United States with a correlation coefficient (R) of -0.368 and weighted average of $65,406. Similarly, the statistical analysis conducted on geographies consisting of 110,268,457 people shows a slight negative correlation between the proportion of Assyrians/Chaldeans/Syriacs and median male earnings in the United States with a correlation coefficient (R) of -0.096 and weighted average of $58,437, a difference of 11.9%.
Median Male Earnings Correlation Summary
| Measurement | Immigrants from Sweden | Assyrian/Chaldean/Syriac |
| Minimum | $8,107 | $38,990 |
| Maximum | $119,732 | $113,676 |
| Range | $111,625 | $74,686 |
| Mean | $70,306 | $63,347 |
| Median | $72,770 | $60,406 |
| Interquartile 25% (IQ1) | $55,777 | $49,882 |
| Interquartile 75% (IQ3) | $83,429 | $75,136 |
| Interquartile Range (IQR) | $27,652 | $25,254 |
| Standard Deviation (Sample) | $24,867 | $16,152 |
| Standard Deviation (Population) | $24,384 | $16,047 |
Similar Demographics by Median Male Earnings
Demographics Similar to Immigrants from Sweden by Median Male Earnings
In terms of median male earnings, the demographic groups most similar to Immigrants from Sweden are Immigrants from Japan ($65,518, a difference of 0.17%), Cypriot ($65,549, a difference of 0.22%), Burmese ($65,236, a difference of 0.26%), Immigrants from Korea ($65,079, a difference of 0.50%), and Immigrants from Northern Europe ($64,987, a difference of 0.65%).
| Demographics | Rating | Rank | Median Male Earnings |
| Okinawans | 100.0 /100 | #14 | Exceptional $67,232 |
| Immigrants | Eastern Asia | 100.0 /100 | #15 | Exceptional $66,903 |
| Eastern Europeans | 100.0 /100 | #16 | Exceptional $66,472 |
| Immigrants | Belgium | 100.0 /100 | #17 | Exceptional $66,125 |
| Indians (Asian) | 100.0 /100 | #18 | Exceptional $66,078 |
| Cypriots | 100.0 /100 | #19 | Exceptional $65,549 |
| Immigrants | Japan | 100.0 /100 | #20 | Exceptional $65,518 |
| Immigrants | Sweden | 100.0 /100 | #21 | Exceptional $65,406 |
| Burmese | 100.0 /100 | #22 | Exceptional $65,236 |
| Immigrants | Korea | 100.0 /100 | #23 | Exceptional $65,079 |
| Immigrants | Northern Europe | 100.0 /100 | #24 | Exceptional $64,987 |
| Immigrants | Denmark | 100.0 /100 | #25 | Exceptional $64,625 |
| Turks | 100.0 /100 | #26 | Exceptional $64,253 |
| Immigrants | Switzerland | 100.0 /100 | #27 | Exceptional $63,944 |
| Russians | 100.0 /100 | #28 | Exceptional $63,939 |
Demographics Similar to Assyrians/Chaldeans/Syriacs by Median Male Earnings
In terms of median male earnings, the demographic groups most similar to Assyrians/Chaldeans/Syriacs are Immigrants from Poland ($58,452, a difference of 0.030%), Jordanian ($58,500, a difference of 0.11%), Immigrants from Brazil ($58,324, a difference of 0.19%), Northern European ($58,588, a difference of 0.26%), and Albanian ($58,680, a difference of 0.42%).
| Demographics | Rating | Rank | Median Male Earnings |
| Immigrants | Southern Europe | 99.0 /100 | #93 | Exceptional $59,217 |
| Immigrants | North Macedonia | 99.0 /100 | #94 | Exceptional $59,189 |
| Immigrants | Lebanon | 98.6 /100 | #95 | Exceptional $58,835 |
| Albanians | 98.4 /100 | #96 | Exceptional $58,680 |
| Northern Europeans | 98.2 /100 | #97 | Exceptional $58,588 |
| Jordanians | 98.1 /100 | #98 | Exceptional $58,500 |
| Immigrants | Poland | 98.0 /100 | #99 | Exceptional $58,452 |
| Assyrians/Chaldeans/Syriacs | 97.9 /100 | #100 | Exceptional $58,437 |
| Immigrants | Brazil | 97.7 /100 | #101 | Exceptional $58,324 |
| Syrians | 97.4 /100 | #102 | Exceptional $58,187 |
| Poles | 97.3 /100 | #103 | Exceptional $58,139 |
| Armenians | 97.3 /100 | #104 | Exceptional $58,134 |
| Immigrants | Western Asia | 97.3 /100 | #105 | Exceptional $58,131 |
| Immigrants | Northern Africa | 96.9 /100 | #106 | Exceptional $58,008 |
| Serbians | 96.8 /100 | #107 | Exceptional $57,975 |