Immigrants from Cambodia vs Assyrian/Chaldean/Syriac Median Male Earnings
COMPARE
Immigrants from Cambodia
Assyrian/Chaldean/Syriac
Median Male Earnings
Median Male Earnings Comparison
Immigrants from Cambodia
Assyrians/Chaldeans/Syriacs
$51,594
MEDIAN MALE EARNINGS
5.5/ 100
METRIC RATING
224th/ 347
METRIC RANK
$58,437
MEDIAN MALE EARNINGS
97.9/ 100
METRIC RATING
100th/ 347
METRIC RANK
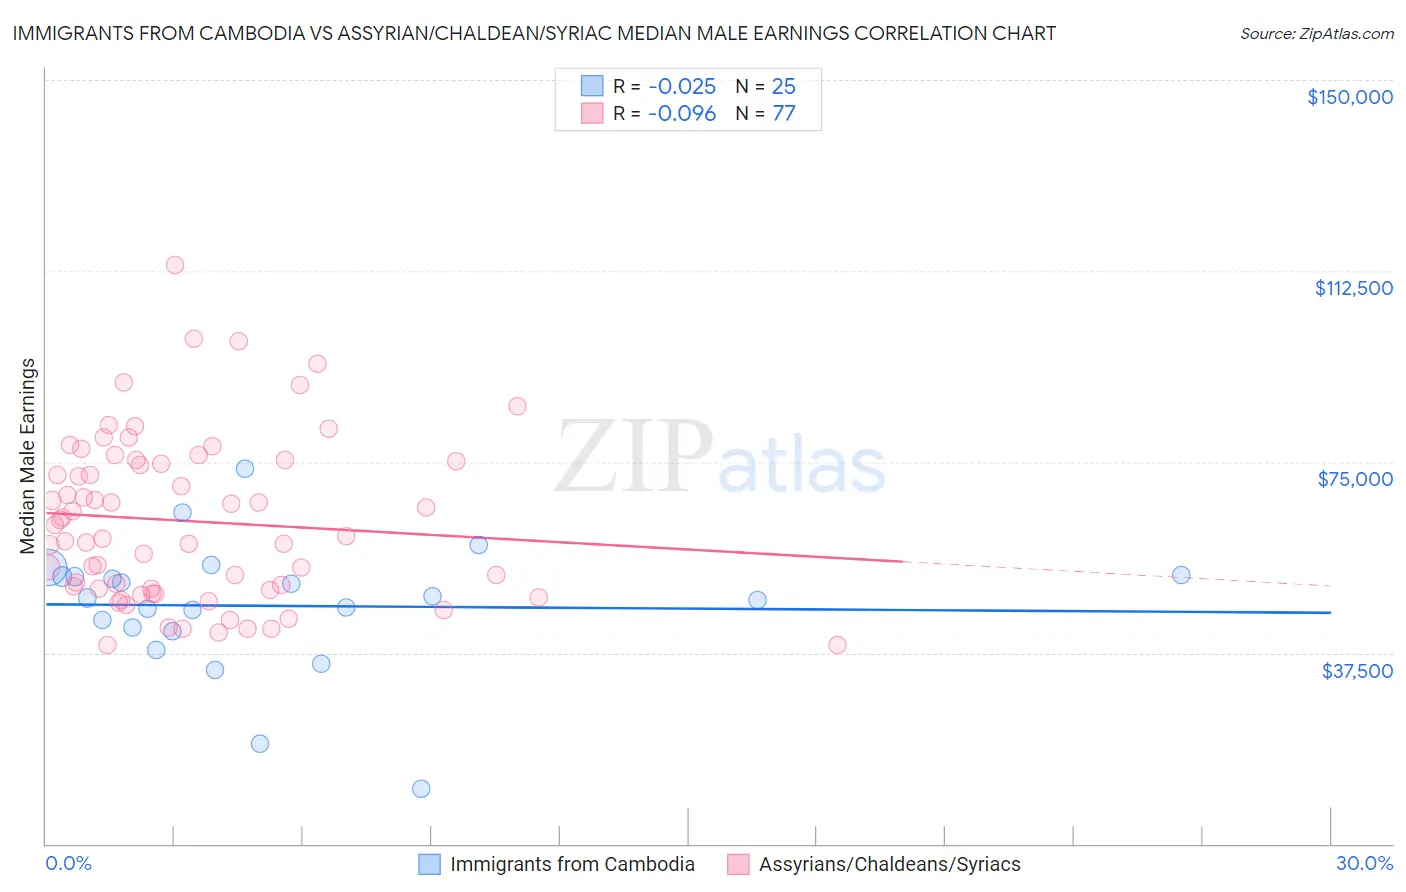
Immigrants from Cambodia vs Assyrian/Chaldean/Syriac Median Male Earnings Correlation Chart
The statistical analysis conducted on geographies consisting of 205,144,142 people shows no correlation between the proportion of Immigrants from Cambodia and median male earnings in the United States with a correlation coefficient (R) of -0.025 and weighted average of $51,594. Similarly, the statistical analysis conducted on geographies consisting of 110,268,457 people shows a slight negative correlation between the proportion of Assyrians/Chaldeans/Syriacs and median male earnings in the United States with a correlation coefficient (R) of -0.096 and weighted average of $58,437, a difference of 13.3%.
Median Male Earnings Correlation Summary
| Measurement | Immigrants from Cambodia | Assyrian/Chaldean/Syriac |
| Minimum | $10,761 | $38,990 |
| Maximum | $73,759 | $113,676 |
| Range | $62,998 | $74,686 |
| Mean | $46,720 | $63,347 |
| Median | $48,267 | $60,406 |
| Interquartile 25% (IQ1) | $42,101 | $49,882 |
| Interquartile 75% (IQ3) | $52,654 | $75,136 |
| Interquartile Range (IQR) | $10,554 | $25,254 |
| Standard Deviation (Sample) | $12,824 | $16,152 |
| Standard Deviation (Population) | $12,565 | $16,047 |
Similar Demographics by Median Male Earnings
Demographics Similar to Immigrants from Cambodia by Median Male Earnings
In terms of median male earnings, the demographic groups most similar to Immigrants from Cambodia are Ecuadorian ($51,596, a difference of 0.0%), Immigrants from Bangladesh ($51,642, a difference of 0.090%), Immigrants from Senegal ($51,647, a difference of 0.10%), Immigrants from Sudan ($51,489, a difference of 0.20%), and Japanese ($51,473, a difference of 0.23%).
| Demographics | Rating | Rank | Median Male Earnings |
| Nigerians | 8.3 /100 | #217 | Tragic $52,039 |
| Immigrants | Panama | 7.7 /100 | #218 | Tragic $51,962 |
| Immigrants | Ghana | 6.9 /100 | #219 | Tragic $51,836 |
| Immigrants | Armenia | 6.6 /100 | #220 | Tragic $51,793 |
| Immigrants | Senegal | 5.8 /100 | #221 | Tragic $51,647 |
| Immigrants | Bangladesh | 5.8 /100 | #222 | Tragic $51,642 |
| Ecuadorians | 5.5 /100 | #223 | Tragic $51,596 |
| Immigrants | Cambodia | 5.5 /100 | #224 | Tragic $51,594 |
| Immigrants | Sudan | 5.0 /100 | #225 | Tragic $51,489 |
| Japanese | 4.9 /100 | #226 | Tragic $51,473 |
| Trinidadians and Tobagonians | 4.8 /100 | #227 | Tragic $51,446 |
| Samoans | 4.6 /100 | #228 | Tragic $51,389 |
| Immigrants | Trinidad and Tobago | 4.5 /100 | #229 | Tragic $51,376 |
| Immigrants | Nigeria | 4.2 /100 | #230 | Tragic $51,310 |
| Barbadians | 3.9 /100 | #231 | Tragic $51,236 |
Demographics Similar to Assyrians/Chaldeans/Syriacs by Median Male Earnings
In terms of median male earnings, the demographic groups most similar to Assyrians/Chaldeans/Syriacs are Immigrants from Poland ($58,452, a difference of 0.030%), Jordanian ($58,500, a difference of 0.11%), Immigrants from Brazil ($58,324, a difference of 0.19%), Northern European ($58,588, a difference of 0.26%), and Albanian ($58,680, a difference of 0.42%).
| Demographics | Rating | Rank | Median Male Earnings |
| Immigrants | Southern Europe | 99.0 /100 | #93 | Exceptional $59,217 |
| Immigrants | North Macedonia | 99.0 /100 | #94 | Exceptional $59,189 |
| Immigrants | Lebanon | 98.6 /100 | #95 | Exceptional $58,835 |
| Albanians | 98.4 /100 | #96 | Exceptional $58,680 |
| Northern Europeans | 98.2 /100 | #97 | Exceptional $58,588 |
| Jordanians | 98.1 /100 | #98 | Exceptional $58,500 |
| Immigrants | Poland | 98.0 /100 | #99 | Exceptional $58,452 |
| Assyrians/Chaldeans/Syriacs | 97.9 /100 | #100 | Exceptional $58,437 |
| Immigrants | Brazil | 97.7 /100 | #101 | Exceptional $58,324 |
| Syrians | 97.4 /100 | #102 | Exceptional $58,187 |
| Poles | 97.3 /100 | #103 | Exceptional $58,139 |
| Armenians | 97.3 /100 | #104 | Exceptional $58,134 |
| Immigrants | Western Asia | 97.3 /100 | #105 | Exceptional $58,131 |
| Immigrants | Northern Africa | 96.9 /100 | #106 | Exceptional $58,008 |
| Serbians | 96.8 /100 | #107 | Exceptional $57,975 |