Immigrants from Latin America vs Assyrian/Chaldean/Syriac Median Male Earnings
COMPARE
Immigrants from Latin America
Assyrian/Chaldean/Syriac
Median Male Earnings
Median Male Earnings Comparison
Immigrants from Latin America
Assyrians/Chaldeans/Syriacs
$46,941
MEDIAN MALE EARNINGS
0.1/ 100
METRIC RATING
301st/ 347
METRIC RANK
$58,437
MEDIAN MALE EARNINGS
97.9/ 100
METRIC RATING
100th/ 347
METRIC RANK
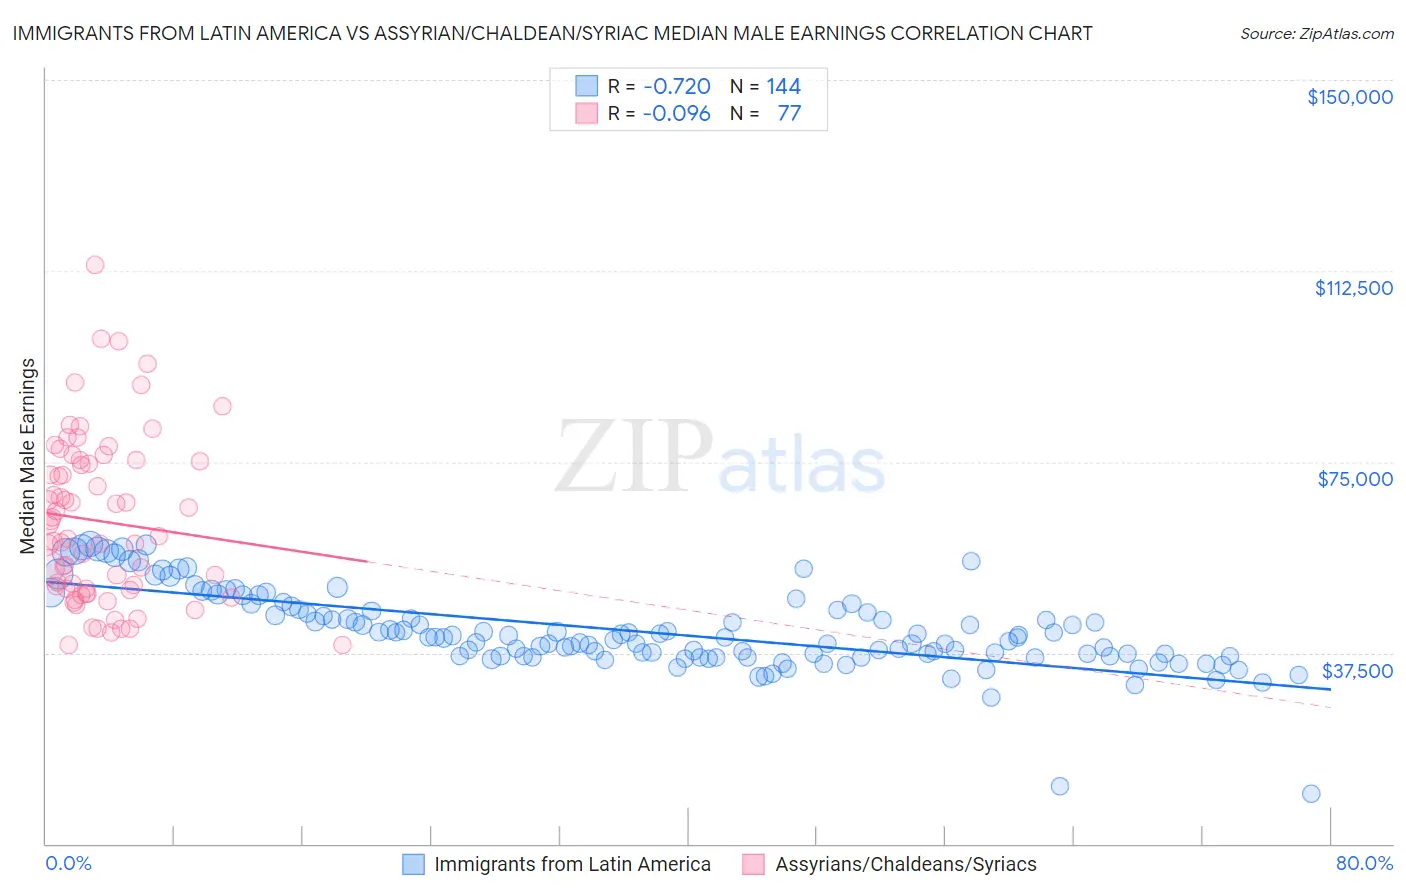
Immigrants from Latin America vs Assyrian/Chaldean/Syriac Median Male Earnings Correlation Chart
The statistical analysis conducted on geographies consisting of 557,625,226 people shows a strong negative correlation between the proportion of Immigrants from Latin America and median male earnings in the United States with a correlation coefficient (R) of -0.720 and weighted average of $46,941. Similarly, the statistical analysis conducted on geographies consisting of 110,268,457 people shows a slight negative correlation between the proportion of Assyrians/Chaldeans/Syriacs and median male earnings in the United States with a correlation coefficient (R) of -0.096 and weighted average of $58,437, a difference of 24.5%.
Median Male Earnings Correlation Summary
| Measurement | Immigrants from Latin America | Assyrian/Chaldean/Syriac |
| Minimum | $9,917 | $38,990 |
| Maximum | $58,917 | $113,676 |
| Range | $49,000 | $74,686 |
| Mean | $41,793 | $63,347 |
| Median | $40,483 | $60,406 |
| Interquartile 25% (IQ1) | $36,804 | $49,882 |
| Interquartile 75% (IQ3) | $45,873 | $75,136 |
| Interquartile Range (IQR) | $9,070 | $25,254 |
| Standard Deviation (Sample) | $7,933 | $16,152 |
| Standard Deviation (Population) | $7,905 | $16,047 |
Similar Demographics by Median Male Earnings
Demographics Similar to Immigrants from Latin America by Median Male Earnings
In terms of median male earnings, the demographic groups most similar to Immigrants from Latin America are U.S. Virgin Islander ($47,066, a difference of 0.27%), Immigrants from Zaire ($47,070, a difference of 0.28%), Seminole ($46,783, a difference of 0.34%), Yaqui ($46,777, a difference of 0.35%), and Bangladeshi ($46,744, a difference of 0.42%).
| Demographics | Rating | Rank | Median Male Earnings |
| Immigrants | Nicaragua | 0.1 /100 | #294 | Tragic $47,482 |
| Central American Indians | 0.1 /100 | #295 | Tragic $47,433 |
| Inupiat | 0.1 /100 | #296 | Tragic $47,281 |
| Dominicans | 0.1 /100 | #297 | Tragic $47,204 |
| Immigrants | Micronesia | 0.1 /100 | #298 | Tragic $47,177 |
| Immigrants | Zaire | 0.1 /100 | #299 | Tragic $47,070 |
| U.S. Virgin Islanders | 0.1 /100 | #300 | Tragic $47,066 |
| Immigrants | Latin America | 0.1 /100 | #301 | Tragic $46,941 |
| Seminole | 0.1 /100 | #302 | Tragic $46,783 |
| Yaqui | 0.1 /100 | #303 | Tragic $46,777 |
| Bangladeshis | 0.1 /100 | #304 | Tragic $46,744 |
| Guatemalans | 0.0 /100 | #305 | Tragic $46,736 |
| Dutch West Indians | 0.0 /100 | #306 | Tragic $46,656 |
| Immigrants | Dominican Republic | 0.0 /100 | #307 | Tragic $46,655 |
| Ottawa | 0.0 /100 | #308 | Tragic $46,611 |
Demographics Similar to Assyrians/Chaldeans/Syriacs by Median Male Earnings
In terms of median male earnings, the demographic groups most similar to Assyrians/Chaldeans/Syriacs are Immigrants from Poland ($58,452, a difference of 0.030%), Jordanian ($58,500, a difference of 0.11%), Immigrants from Brazil ($58,324, a difference of 0.19%), Northern European ($58,588, a difference of 0.26%), and Albanian ($58,680, a difference of 0.42%).
| Demographics | Rating | Rank | Median Male Earnings |
| Immigrants | Southern Europe | 99.0 /100 | #93 | Exceptional $59,217 |
| Immigrants | North Macedonia | 99.0 /100 | #94 | Exceptional $59,189 |
| Immigrants | Lebanon | 98.6 /100 | #95 | Exceptional $58,835 |
| Albanians | 98.4 /100 | #96 | Exceptional $58,680 |
| Northern Europeans | 98.2 /100 | #97 | Exceptional $58,588 |
| Jordanians | 98.1 /100 | #98 | Exceptional $58,500 |
| Immigrants | Poland | 98.0 /100 | #99 | Exceptional $58,452 |
| Assyrians/Chaldeans/Syriacs | 97.9 /100 | #100 | Exceptional $58,437 |
| Immigrants | Brazil | 97.7 /100 | #101 | Exceptional $58,324 |
| Syrians | 97.4 /100 | #102 | Exceptional $58,187 |
| Poles | 97.3 /100 | #103 | Exceptional $58,139 |
| Armenians | 97.3 /100 | #104 | Exceptional $58,134 |
| Immigrants | Western Asia | 97.3 /100 | #105 | Exceptional $58,131 |
| Immigrants | Northern Africa | 96.9 /100 | #106 | Exceptional $58,008 |
| Serbians | 96.8 /100 | #107 | Exceptional $57,975 |