Tsimshian vs Assyrian/Chaldean/Syriac Single Male Poverty
COMPARE
Tsimshian
Assyrian/Chaldean/Syriac
Single Male Poverty
Single Male Poverty Comparison
Tsimshian
Assyrians/Chaldeans/Syriacs
11.1%
SINGLE MALE POVERTY
100.0/ 100
METRIC RATING
17th/ 347
METRIC RANK
9.8%
SINGLE MALE POVERTY
100.0/ 100
METRIC RATING
1st/ 347
METRIC RANK
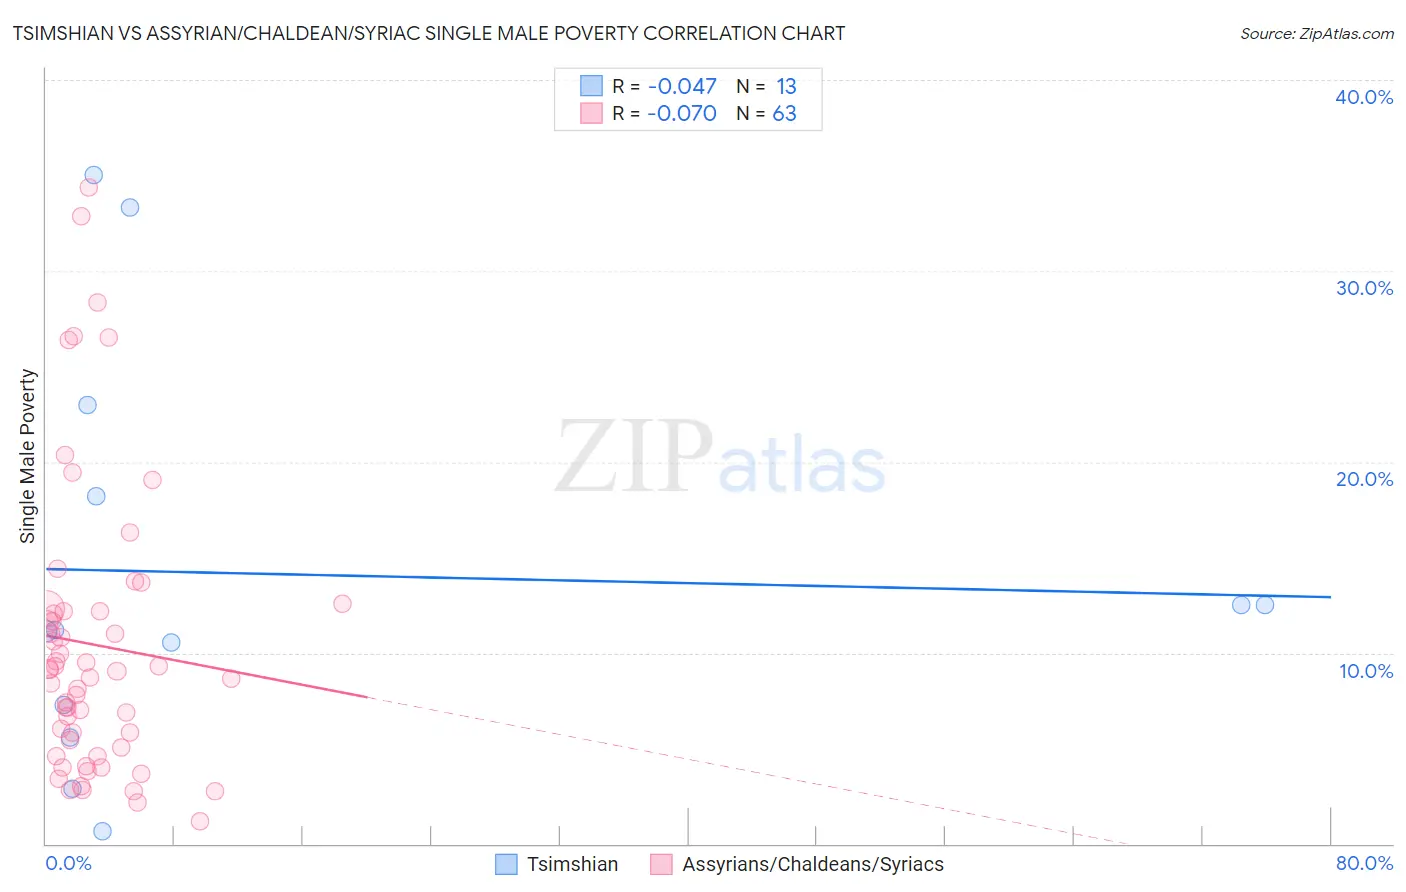
Tsimshian vs Assyrian/Chaldean/Syriac Single Male Poverty Correlation Chart
The statistical analysis conducted on geographies consisting of 15,184,225 people shows no correlation between the proportion of Tsimshian and poverty level among single males in the United States with a correlation coefficient (R) of -0.047 and weighted average of 11.1%. Similarly, the statistical analysis conducted on geographies consisting of 104,209,222 people shows a slight negative correlation between the proportion of Assyrians/Chaldeans/Syriacs and poverty level among single males in the United States with a correlation coefficient (R) of -0.070 and weighted average of 9.8%, a difference of 13.6%.
Single Male Poverty Correlation Summary
| Measurement | Tsimshian | Assyrian/Chaldean/Syriac |
| Minimum | 0.66% | 1.2% |
| Maximum | 35.0% | 34.4% |
| Range | 34.3% | 33.2% |
| Mean | 14.1% | 10.4% |
| Median | 11.2% | 9.1% |
| Interquartile 25% (IQ1) | 6.4% | 5.0% |
| Interquartile 75% (IQ3) | 20.6% | 12.2% |
| Interquartile Range (IQR) | 14.2% | 7.2% |
| Standard Deviation (Sample) | 10.7% | 7.5% |
| Standard Deviation (Population) | 10.2% | 7.5% |
Demographics Similar to Tsimshian and Assyrians/Chaldeans/Syriacs by Single Male Poverty
In terms of single male poverty, the demographic groups most similar to Tsimshian are Bhutanese (11.1%, a difference of 0.090%), Immigrants from Bolivia (11.1%, a difference of 0.33%), Immigrants from Moldova (11.2%, a difference of 0.72%), Ethiopian (11.2%, a difference of 0.74%), and Korean (11.0%, a difference of 0.85%). Similarly, the demographic groups most similar to Assyrians/Chaldeans/Syriacs are Immigrants from Taiwan (10.3%, a difference of 5.3%), Immigrants from India (10.3%, a difference of 6.0%), Immigrants from Hong Kong (10.4%, a difference of 7.0%), Tongan (10.5%, a difference of 7.1%), and Filipino (10.6%, a difference of 8.9%).
| Demographics | Rating | Rank | Single Male Poverty |
| Assyrians/Chaldeans/Syriacs | 100.0 /100 | #1 | Exceptional 9.8% |
| Immigrants | Taiwan | 100.0 /100 | #2 | Exceptional 10.3% |
| Immigrants | India | 100.0 /100 | #3 | Exceptional 10.3% |
| Immigrants | Hong Kong | 100.0 /100 | #4 | Exceptional 10.4% |
| Tongans | 100.0 /100 | #5 | Exceptional 10.5% |
| Filipinos | 100.0 /100 | #6 | Exceptional 10.6% |
| Afghans | 100.0 /100 | #7 | Exceptional 10.7% |
| Thais | 100.0 /100 | #8 | Exceptional 10.8% |
| Taiwanese | 100.0 /100 | #9 | Exceptional 10.9% |
| Immigrants | Fiji | 100.0 /100 | #10 | Exceptional 10.9% |
| Immigrants | Philippines | 100.0 /100 | #11 | Exceptional 10.9% |
| Immigrants | Afghanistan | 100.0 /100 | #12 | Exceptional 10.9% |
| Immigrants | South Central Asia | 100.0 /100 | #13 | Exceptional 10.9% |
| Chinese | 100.0 /100 | #14 | Exceptional 11.0% |
| Koreans | 100.0 /100 | #15 | Exceptional 11.0% |
| Bhutanese | 100.0 /100 | #16 | Exceptional 11.1% |
| Tsimshian | 100.0 /100 | #17 | Exceptional 11.1% |
| Immigrants | Bolivia | 100.0 /100 | #18 | Exceptional 11.1% |
| Immigrants | Moldova | 100.0 /100 | #19 | Exceptional 11.2% |
| Ethiopians | 100.0 /100 | #20 | Exceptional 11.2% |