Tsimshian vs Dutch Median Female Earnings
COMPARE
Tsimshian
Dutch
Median Female Earnings
Median Female Earnings Comparison
Tsimshian
Dutch
$39,530
MEDIAN FEMALE EARNINGS
41.4/ 100
METRIC RATING
181st/ 347
METRIC RANK
$37,339
MEDIAN FEMALE EARNINGS
0.7/ 100
METRIC RATING
260th/ 347
METRIC RANK
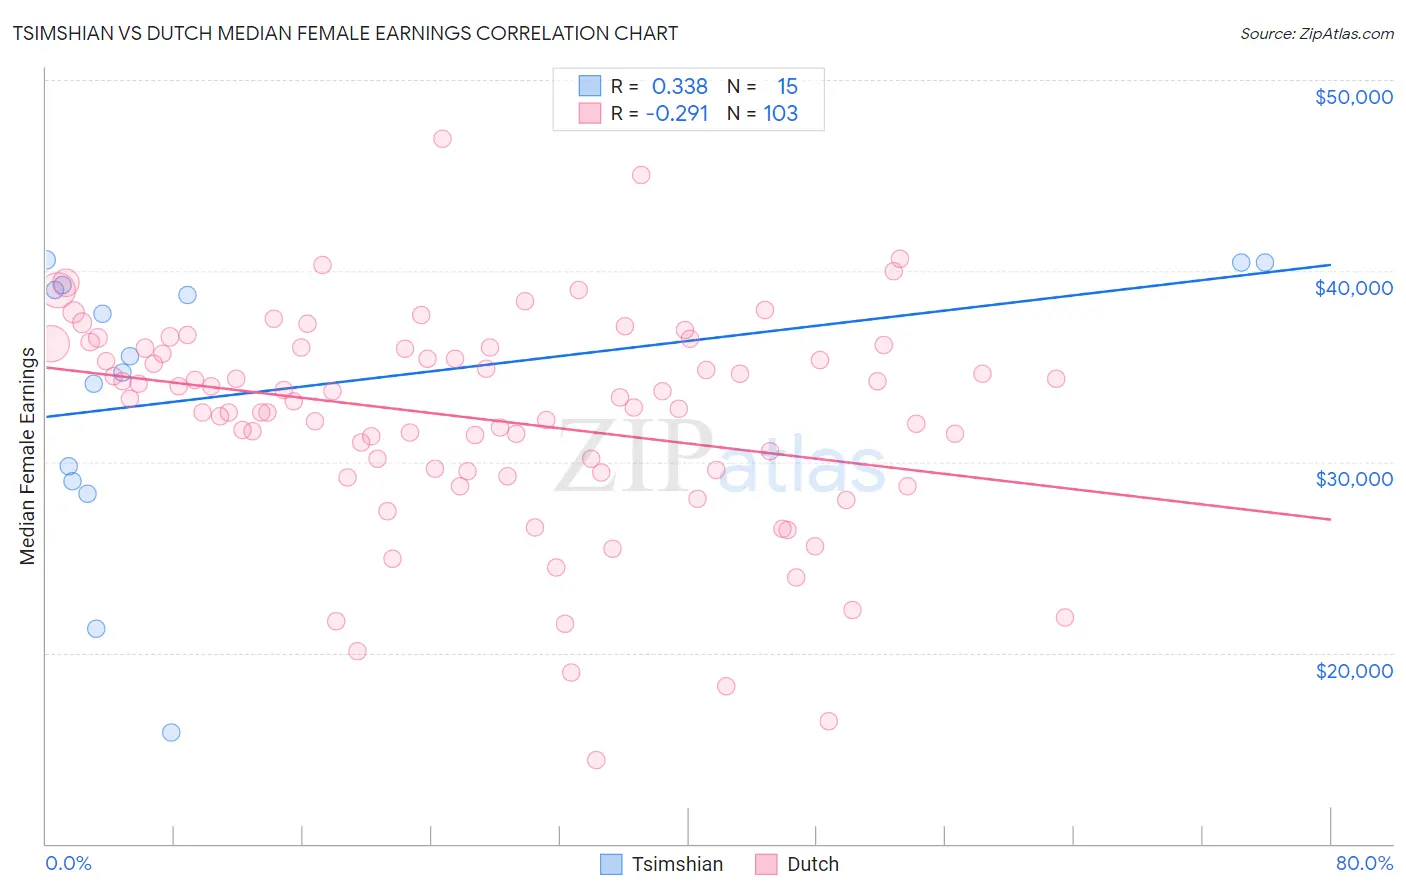
Tsimshian vs Dutch Median Female Earnings Correlation Chart
The statistical analysis conducted on geographies consisting of 15,624,755 people shows a mild positive correlation between the proportion of Tsimshian and median female earnings in the United States with a correlation coefficient (R) of 0.338 and weighted average of $39,530. Similarly, the statistical analysis conducted on geographies consisting of 553,021,757 people shows a weak negative correlation between the proportion of Dutch and median female earnings in the United States with a correlation coefficient (R) of -0.291 and weighted average of $37,339, a difference of 5.9%.
Median Female Earnings Correlation Summary
| Measurement | Tsimshian | Dutch |
| Minimum | $15,833 | $14,375 |
| Maximum | $40,588 | $46,907 |
| Range | $24,755 | $32,532 |
| Mean | $33,643 | $32,260 |
| Median | $35,500 | $33,299 |
| Interquartile 25% (IQ1) | $28,977 | $29,508 |
| Interquartile 75% (IQ3) | $39,276 | $35,979 |
| Interquartile Range (IQR) | $10,299 | $6,471 |
| Standard Deviation (Sample) | $7,485 | $5,704 |
| Standard Deviation (Population) | $7,232 | $5,676 |
Similar Demographics by Median Female Earnings
Demographics Similar to Tsimshian by Median Female Earnings
In terms of median female earnings, the demographic groups most similar to Tsimshian are Immigrants from Kenya ($39,535, a difference of 0.010%), Tlingit-Haida ($39,513, a difference of 0.050%), Hungarian ($39,510, a difference of 0.050%), Immigrants from Germany ($39,603, a difference of 0.18%), and European ($39,457, a difference of 0.19%).
| Demographics | Rating | Rank | Median Female Earnings |
| South Americans | 50.0 /100 | #174 | Average $39,698 |
| Immigrants | South America | 47.2 /100 | #175 | Average $39,643 |
| Nigerians | 47.0 /100 | #176 | Average $39,641 |
| Costa Ricans | 46.1 /100 | #177 | Average $39,622 |
| Slavs | 45.6 /100 | #178 | Average $39,613 |
| Immigrants | Germany | 45.1 /100 | #179 | Average $39,603 |
| Immigrants | Kenya | 41.6 /100 | #180 | Average $39,535 |
| Tsimshian | 41.4 /100 | #181 | Average $39,530 |
| Tlingit-Haida | 40.5 /100 | #182 | Average $39,513 |
| Hungarians | 40.3 /100 | #183 | Average $39,510 |
| Europeans | 37.7 /100 | #184 | Fair $39,457 |
| Immigrants | West Indies | 36.9 /100 | #185 | Fair $39,441 |
| Colombians | 36.9 /100 | #186 | Fair $39,439 |
| Swedes | 36.0 /100 | #187 | Fair $39,421 |
| Bermudans | 35.9 /100 | #188 | Fair $39,418 |
Demographics Similar to Dutch by Median Female Earnings
In terms of median female earnings, the demographic groups most similar to Dutch are Malaysian ($37,298, a difference of 0.11%), Scotch-Irish ($37,383, a difference of 0.12%), Venezuelan ($37,282, a difference of 0.15%), Belizean ($37,429, a difference of 0.24%), and Hawaiian ($37,497, a difference of 0.42%).
| Demographics | Rating | Rank | Median Female Earnings |
| Danes | 1.6 /100 | #253 | Tragic $37,730 |
| Whites/Caucasians | 1.1 /100 | #254 | Tragic $37,531 |
| Colville | 1.1 /100 | #255 | Tragic $37,514 |
| Samoans | 1.0 /100 | #256 | Tragic $37,498 |
| Hawaiians | 1.0 /100 | #257 | Tragic $37,497 |
| Belizeans | 0.9 /100 | #258 | Tragic $37,429 |
| Scotch-Irish | 0.8 /100 | #259 | Tragic $37,383 |
| Dutch | 0.7 /100 | #260 | Tragic $37,339 |
| Malaysians | 0.7 /100 | #261 | Tragic $37,298 |
| Venezuelans | 0.7 /100 | #262 | Tragic $37,282 |
| German Russians | 0.5 /100 | #263 | Tragic $37,105 |
| Salvadorans | 0.4 /100 | #264 | Tragic $37,083 |
| Immigrants | Belize | 0.4 /100 | #265 | Tragic $37,056 |
| Dominicans | 0.4 /100 | #266 | Tragic $37,046 |
| Immigrants | Nonimmigrants | 0.4 /100 | #267 | Tragic $37,024 |